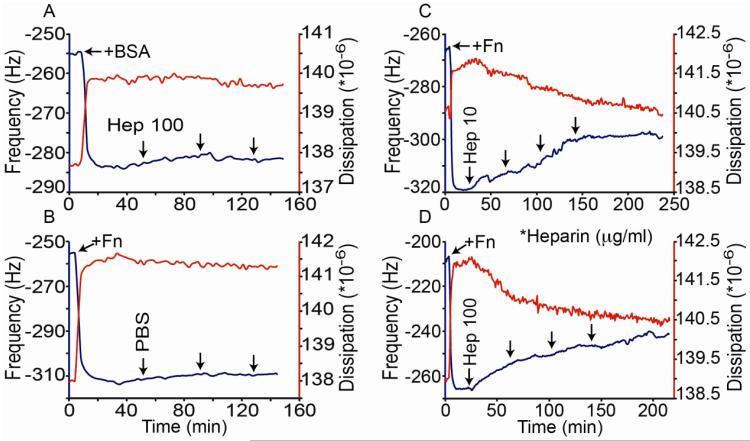
Figure 1.
Heparin-induced conformation changes shown by QCMD. A) Frequency (blue) and dissipation curves (red) are shown before and after adsorption of BSA to the chip which causes the initial decrease in frequency and increase in dissipation. Ten minute pulses of heparin (100 μg/ml) flowed over the chip surface followed by 30 minute incubations are indicated by the arrows. B) Frequency and dissipation curves are shown before and after adsorption of Fn to the chip. PBS was exposed to the chip surface using the same pulse flow/incubation sequence as described in A). C) and D) Frequency and dissipation data are shown after adsorption of Fn to the chip, followed by exposed to heparin at 10 or 100 μg/ml as indicated using the same pulse flow/incubation sequence as in panels A) and B). The addition of heparin to the Fn surfaces caused noticeable changes in frequency and dissipation. The observed initial rates of change of the frequency (F) and dissipation (D) were greater for the higher heparin dose (ΔF/ΔT = 0.11 and 0.24 Hz/min; and ΔD/ΔT = −1.3×10⁴ and −2.1×10⁴ units/min for 10 and 100 μg/ml heparin respectively). A similar heparin-induced change in frequency and dissipation of Fn coated chips was observed in 5 separate experiments.

