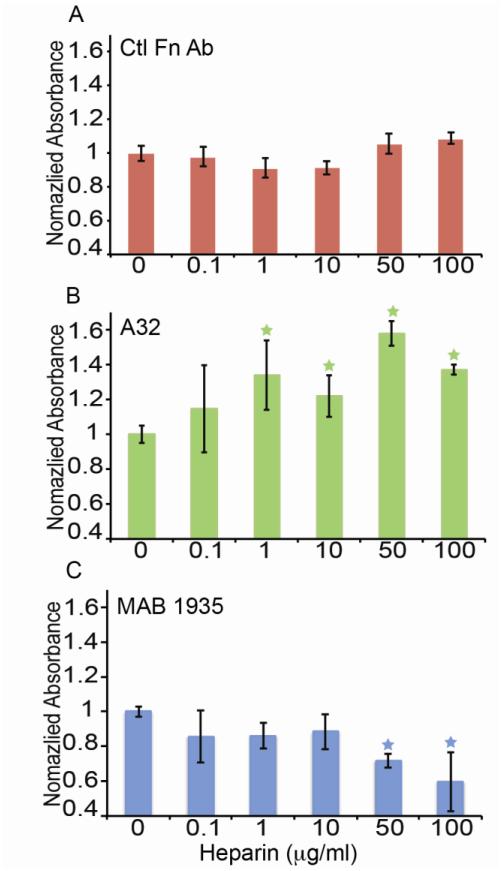
Figure 2.
ELISA data for the binding of Abs raised to the Hep2 domain (A32, MAB1935) and Ctl Fn Ab. A) Mean ± standard deviation ELISA values are shown for Ctl Fn Ab when exposed to a heparin concentration ladder (n=12) B) Mean ± standard deviation ELISA values for A32 are shown when exposed to the heparin concentration ladder and show an increase with heparin treatment (n=12). Values were normalized to the no heparin condition. C) Mean ± standard deviation ELISA values for MAB1935 are shown when exposed to the heparin concentration ladder and decrease with heparin treatment (n=12). Values were normalized to the no heparin condition. Asterisks indicate statistically significant trends according to ANOVA (P<0.05)

