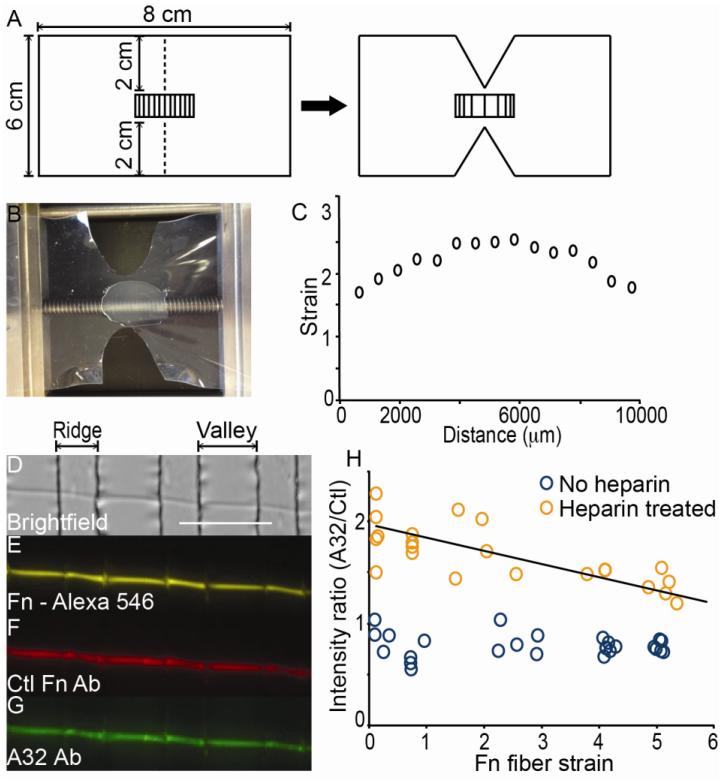
Figure 3.
Strain gradient creation and single Fn fiber staining with A32 and Ctl Fn Ab. A) A schematic for preparation of the strain gradient pattern is shown. The dimensions for a rectangle of PDMS, with micropatterned ridges, is shown with dotted lines indicating incision points. After application of strain to the sheet, the incision leads to a gradient with highest strain between the incision that decreases moving progressively away from the middle of the PDMS sheet. B) A representative image of a PDMS sheet with a strain gradient pattern is shown clamped within the strain device. The sheet is stretched to a length of 10.5 cm. C) The strain values were measured on a gradient-stretched PDMS substrate by measuring the width of microfabricated ridges/valleys, Li. Relative strain was calculated according to Li/L where L is the unstretched width of the valleys (20 μm). D-G) A brightfield image (D) is shown of a single Fn fiber fluorescently labeled with Alex-546 (E) after incubation with both the Ctl Fn Ab (F), the A32 Ab (G), and fluorescently labeled secondary Abs. H) Intensity ratios (A32/Ctl) are shown for Fn fibers stretched over a wide range of strains with (orange circles) or without prior exposure to heparin at 50 μg/ml (blue circles). Each circle represents one field of view for a single Fn fiber measured over the valleys. Four experiments for untreated and heparin treated fibers were conducted to populate the graph. The regression of intensity ratio versus strain for heparin-treated fibers was statistically different from 0, showing a trend as a function of strain, by using the standard error of the slope. (scale bar = 100 μm). Line equation: y = −0.1103x + 1.9177.

