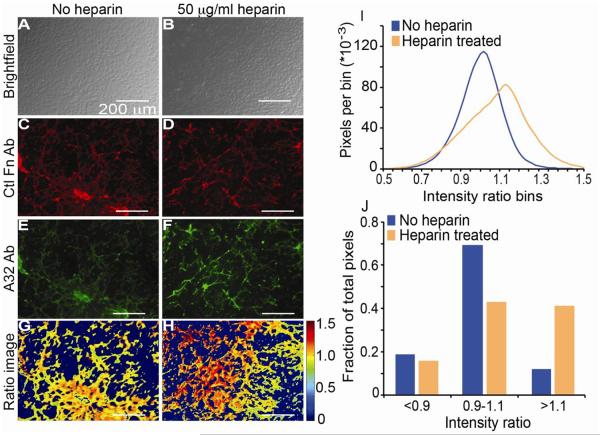
Figure 4.
BAEC-derived ECM staining with A32 and Ctl Fn Abs. A-B) Brightfield images of BAEC cultured to a confluent state and then untreated (A) or treated with 50 μg/ml heparin (B) are shown. C-D) Fluorescent microscopic images are shown of fixed BAEC samples without (C) or with heparin exposure (D) followed by incubation with Ctl Fn Ab and DyLight 650-labeled secondary. E-F) Fluorescent microscopic images are shown of fixed BAEC samples without (E) or with heparin exposure (F) followed by incubation with A32 Ab and FITC-labeled secondary. G-H) False-colored intensity ratio images are shown for BAEC samples without (G) and with heparin exposure (H). The colorbar indicates that range of ratios in the images. I) A histogram of intensity ratios is shown for all above background pixels from 5 fields of view from 3 samples with (orange line) or without heparin exposure (blue line). J) Histograms were broken into bins with values <0.9, between 0.9 and 1.1, and >1.1 so that the fraction of pixels in each bin is plotted with (orange) or without heparin exposure (blue). Pixel analysis of 5 images from 3 wells of cells.

