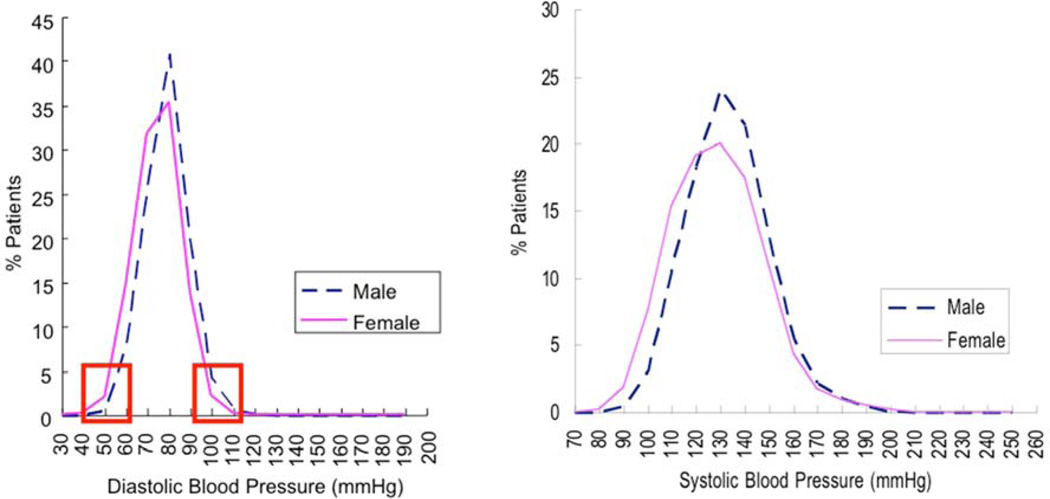
Figure 1. Population BP extremes: A powerful approach to genotypes underlying hypertension.
Blood pressure distribution in a primary care population of ~53,000 adults. From a primary care database of over 53,000 people (27,478 females and 25,528 males), we ascertained age-, gender-and ethnicity-matched individuals with extremely high and low DBPs (from the upper and lower 5th percentiles of the DBP distribution). This approach has >90% power to detect loci contributing >2.5% of BP variance. Red rectangles: DBP range for upper and lower %ile (extreme) sample selection. Schork et al. AJHG 67:1208–1218, 2000. Kaiser health maintenance screening, San Diego, California.

