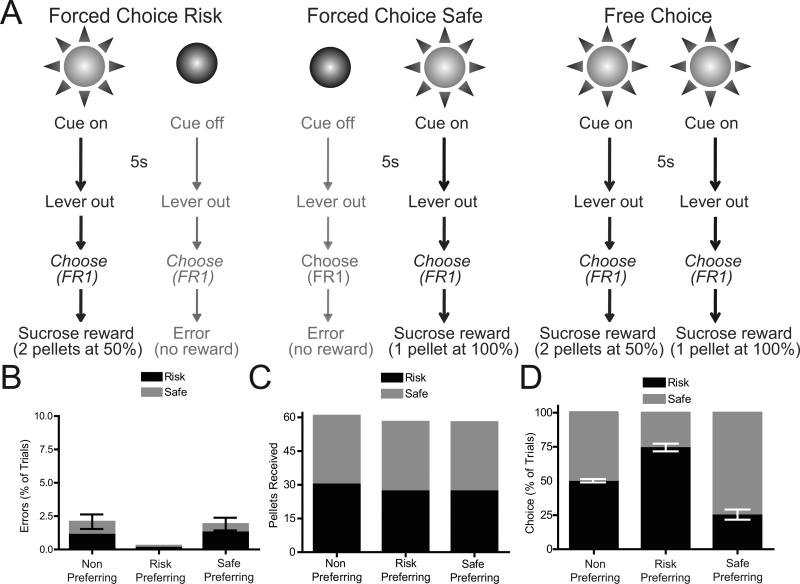
Figure 1.
Risky decision making task and behavior. (A) Schematic representation of risky decision making task. See main text and Supplementary Materials for details. (B) Percentage of errors on Risk and Safe trials were not significantly different from 0 (P>0.1 for all comparisons), demonstrating behavioral discriminations between cues. (C) Reward pellets received during Risk and Safe trials. All groups of animals received maximum amounts of rewards (30 pellets for each trial type). (D) Response allocation on choice trials (as a percentage of choice) during recording sessions. Three groups of rats were observed: non-preferring rats chose both options equally (P=0.516), risk preferring rats chose the risk lever significantly more than chance (P<0.0001), safe preferring rats chose the safe lever significantly more than chance (P=0.0007).

