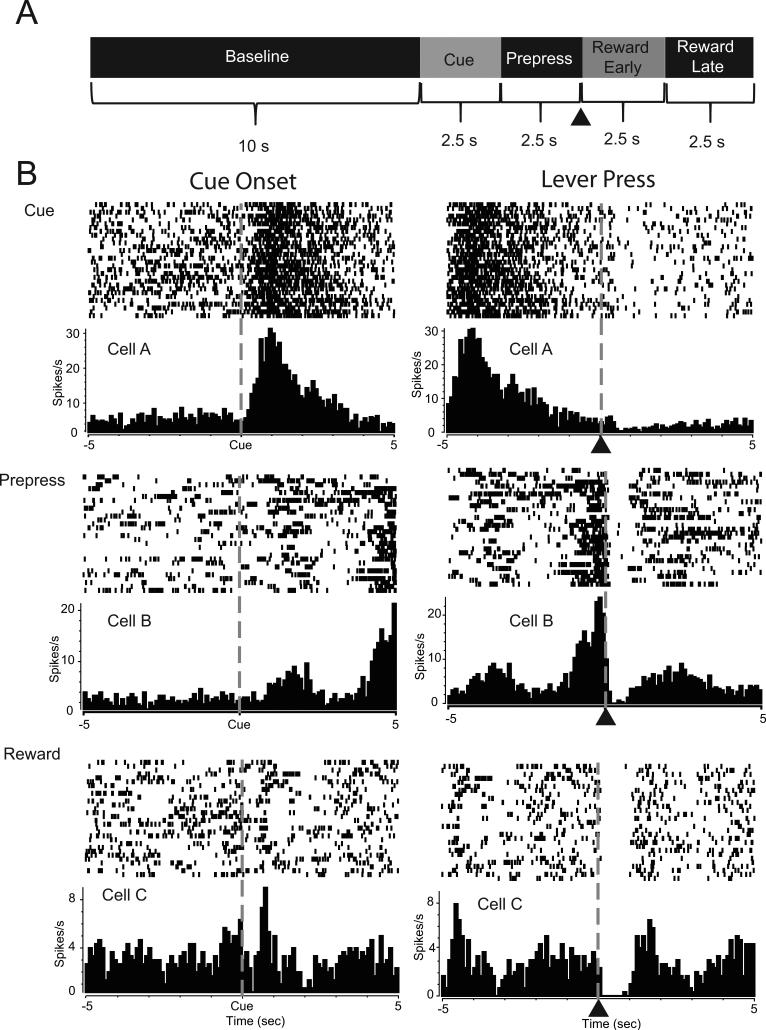
Figure 2.
NAc neurons display patterned discharges during distinct components of the task. (A) Schematic representation of epochs used to analyze and classify neural data. Neural activity during each time epoch was compared to a 10 s baseline period. Neurons that displayed significant increases or decreases in firing rate 2.5 s following cue onset were classified as cue-related cells. Neurons exhibiting significant increases or decreases in firing rate during 2.5 s prior to the lever press were classified as prepress cells. Neurons showing increases or decreases in activity during the initial 2.5 s period following the lever press (denoted by ▲) were classified as the reward early cells while neurons showing patterned discharges during the next 2.5s period were classified as reward late cells. (B) Peri-event histogram (PEH) and raster plots of representative NAc neurons. Each cell is aligned to cue onset (left panel) and lever press (denoted by ▲; right panel). Cell A (Top) is a cue-related cell showing increased activity immediately after cue onset. Cell B (Middle) is an example of a prepress cell, showing increased activity prior to the lever press. Cell C (Bottom) shows a neuron that exhibited a decrease (inhibition) in firing rate following the lever press during the reward period.

