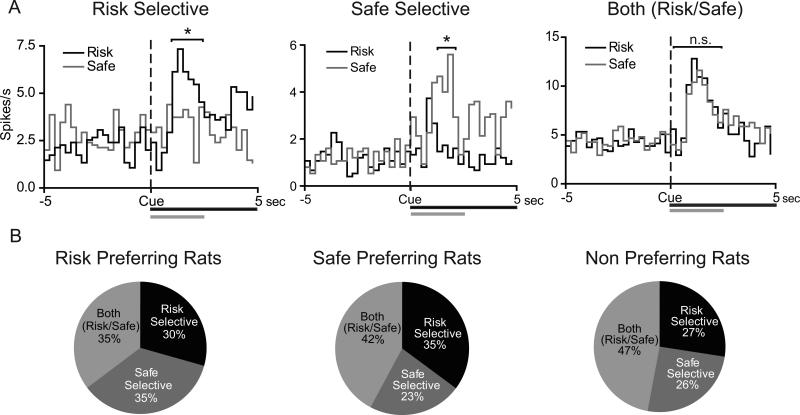
Figure 3.
NAc neurons display cue-selective encoding during safe versus risk forced trials. (A) PEHs of representative risk selective (left panel), safe selective (middle panel) and both (risk/safe) (right panel) cue activated NAc neurons during the risky decision making task. Data are aligned to cue onset (black bar/dashed line). Grey bar signifies 2.5s cue effect period. Time bins in which neural activity is significantly increased is signified by * (P<0.05). (B) Percentages of phasic cells that display the three different types of encoding in the risk preferring (left), safe preferring (middle), and non-preferring (right) rats. There were no differences in the population encoding of cue selectivity across the three groups of rats (P=0.653).

