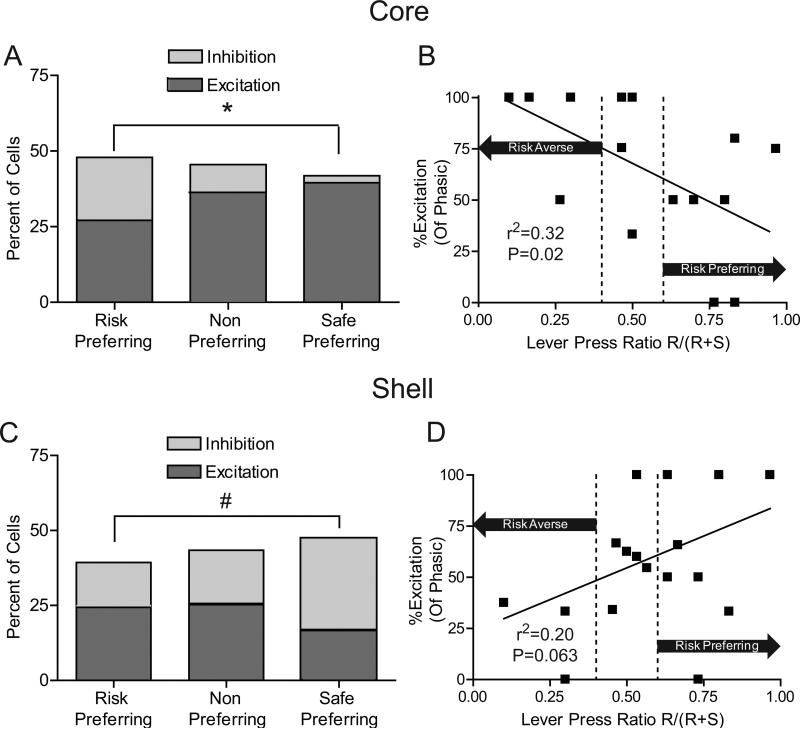
Figure 9.
Individual risk preferences related to reward omission processing. (A) Percentages of NAc core cells that exhibited excitations versus inhibitions during the reward omission period in each of the three groups. There was no significant difference in the percentage of cells that were phasic during reward omissions; however, safe preferring rats had a significantly greater percentage of cells that exhibited excitations versus inhibitions compared to risk preferring animals. (B) Percentage of NAc core phasic cells that displayed excitations plotted against individual risk preferences. The x-axis is a lever press ratio that indicates the risk preference of each animal during free choice trials. The ratio was determined by dividing the number of presses on the risk lever during free choice trials by the total number of presses on free choice trials (Risk/(Risk+Safe)). A ratio greater than 0.6 indicates that an animal is risk-prone while a ratio of less than 0.4 indicates an animal is risk-averse. Area in between the dotted lines indicates no preference. The y-axis is the percentage of phasic cells that showed significant excitations during the reward omission period. Only animals with at least 5 cells recorded in each region were included in the analysis as to not bias results due to low cell counts (C) Reward omission processing in the NAc shell. There was no significant difference in the amount of cells that were phasic during reward omissions; however, risk preferring rats showed a trend towards a lower percentage of cells that exhibited inhibitions versus excitations compared to safe preferring rats. (D) Percentage of phasic cells that display excitations in the NAc shell plotted against individual risk preferences. Conventions follow from B. *P<0.05, #P<0.1.

