
Figure 4.
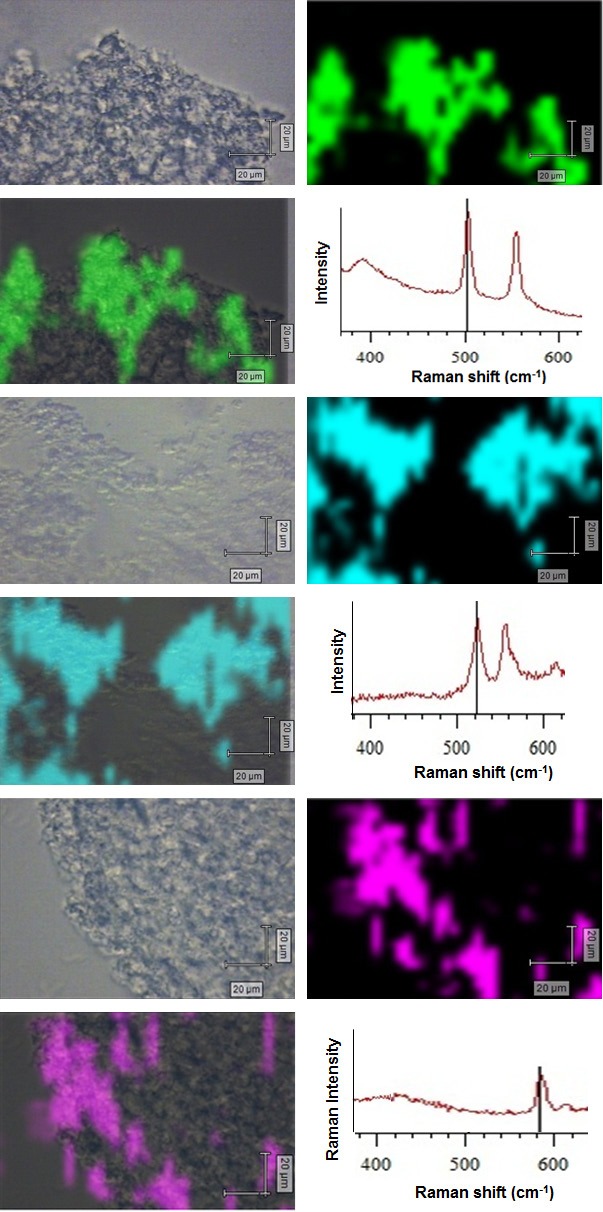
Bright field, SERS mapping images, merged images and complementary SERS spectra of differentiated mouse embryonic stem cells (mESC) treated with three multiplexed mamotags (CyRLA-572@AuNPs@PEG-anti-CD34, Cy7LA@AuNPs@PEG-anti-CD184 and Cy7.5LA@AuNPs@PEG-anti-Notch1. All mapping images were scanned at multiplex peaks of corresponding nanotags (523 cm-1, 503 cm-1 and 584 cm-1) at an interval of 2 μm (785 nm excitation) and the intensities were normalized between the lowest (0) and the highest color (1) values. Scale bar: 20 μm.