
Figure 5.
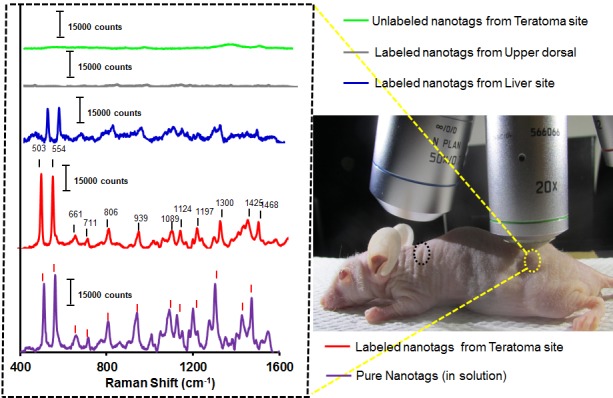
In vivo SERS spectra from teratoma (yellow circle) and non-teratoma (upper dorsal; black circle) regions upon injection of Cy7LA@AuNPs@PEG-anti-CD184 nanotags. The spectra were scanned at an interval of 2 μm (785 nm excitation wavelength) and the intensities were normalized after baseline corrections; acquisition time: 30 s.