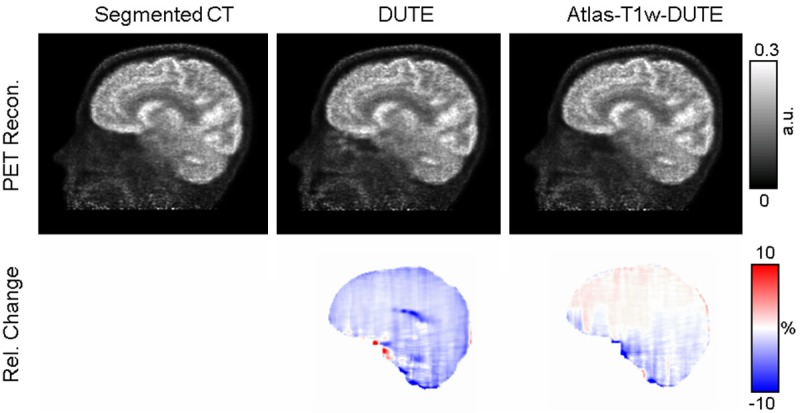
Figure 5.

Representative PET images from the data reconstructed using the segmented CT (A), DUTE (B), and Atlas-T1w-DUTE (C) μ-maps from a representative subject are shown in row 1. The corresponding Relative Change maps computed using each estimated reconstruction and the CT-based reconstruction (as the “silver standard”) are shown in row 2.
