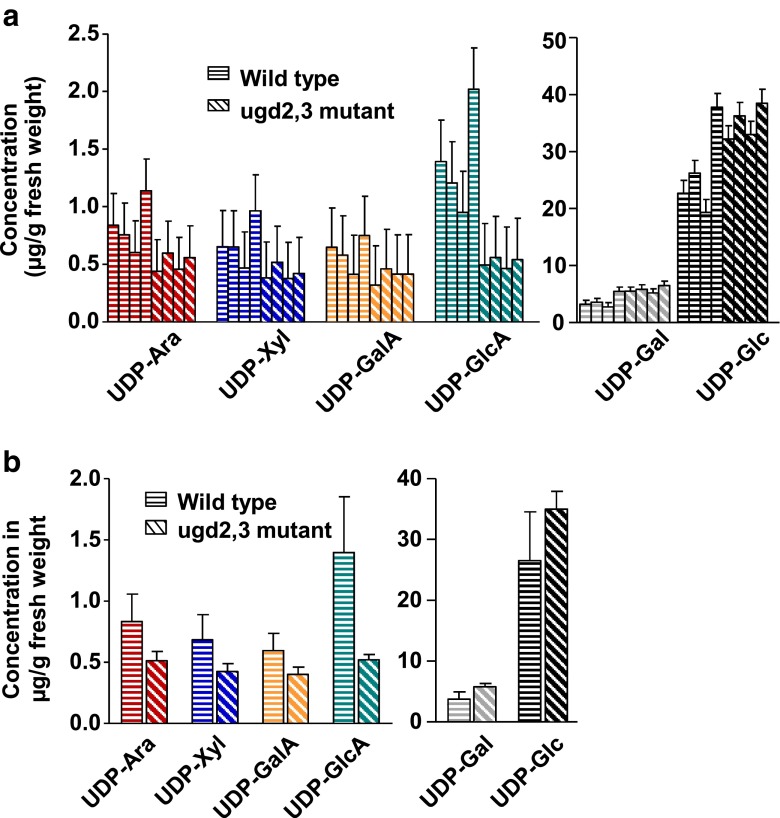
Fig. 5.
Comparison of UDP-Ara, UDP-Xyl, UDP-GalA, UDP-GlcA, UDP-Gal and UDP-Glc concentrations in Arabidopsis wild-type and ugd2,3 mutant plants. The values shown are the results of triplicate measurement of four biological replicates each (a) or the averages over all four biological replicates (b). Error bars in a are reflecting the 95 % confidence intervals using linear or quadratic regression calculation. The error bars in b stand for the standard deviations calculated from the four biological replicates

