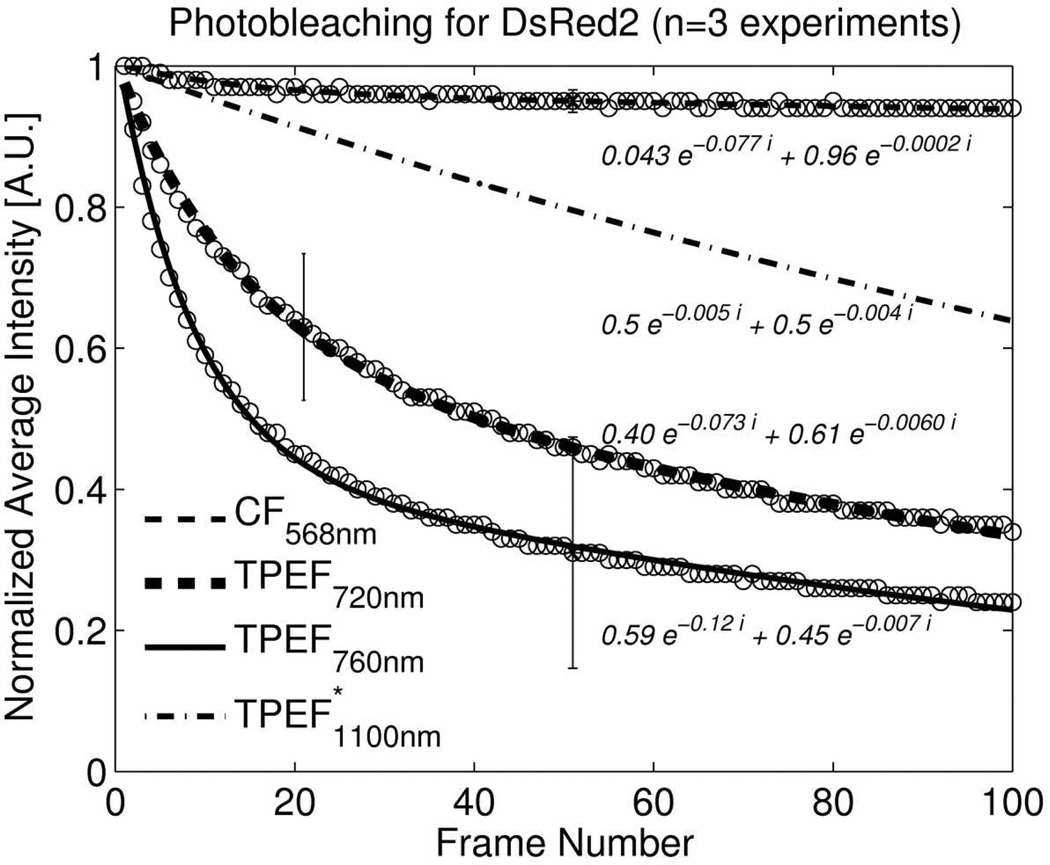
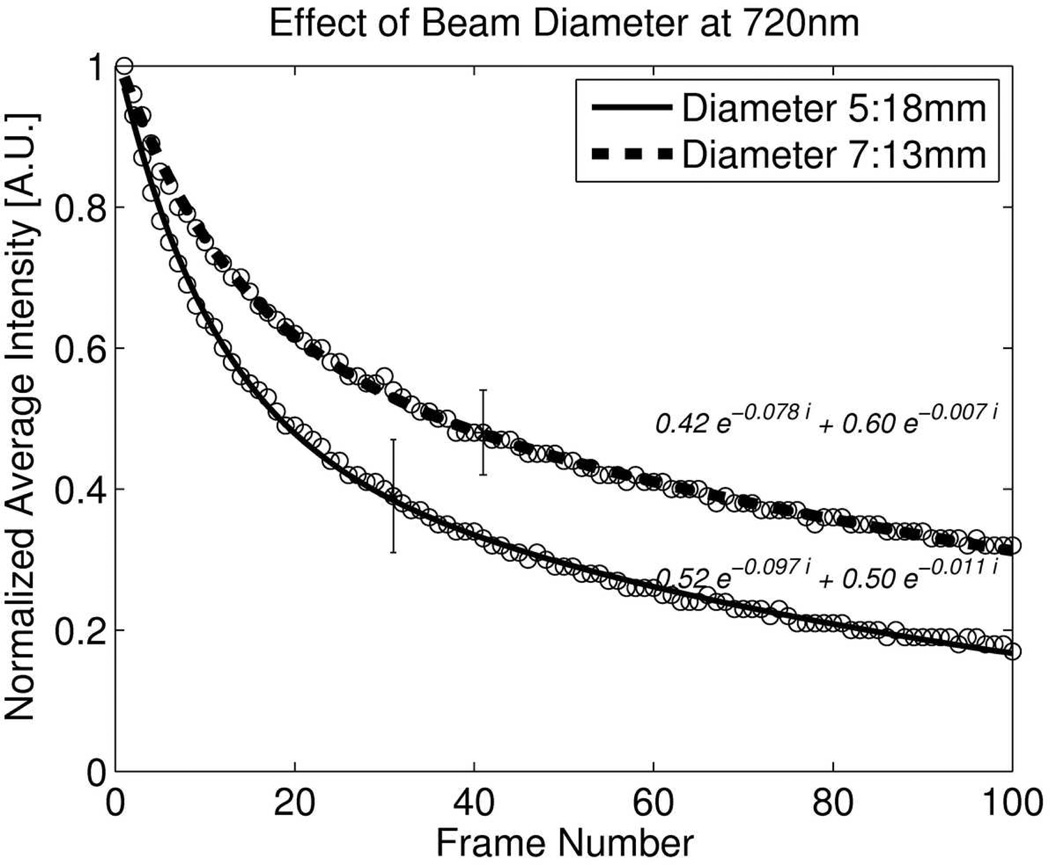
Figure 6.
a: Photobleaching of DsRed2 measured as decrease in emission intensity during consecutive scanning for confocal (568nm, 9.2µW at sample) and two photon imaging (720nm, 22mW, 760nm 44mW). Settings resulted in same average intensity on same type of PMT sensor. Data at 1100nm was taken from Andresen et al(Andresen, et al., 2009) and scaled so that our and their data at 760nm matched. The samples were subjected to 100 consecutive scans. For illustration, emission intensities were normalized according to the intensities obtained in the first frame. All curves were fitted to two-exponential functions.
b: Photobleaching of eGFP for confocal (488nm, 102 µW) and two photon imaging (920nm, 22mW). Data was obtained on LSM510, 40× NA:1.0 WI.
c: Effect of two different beam diameters on DsRed2 bleaching at 720nm.


