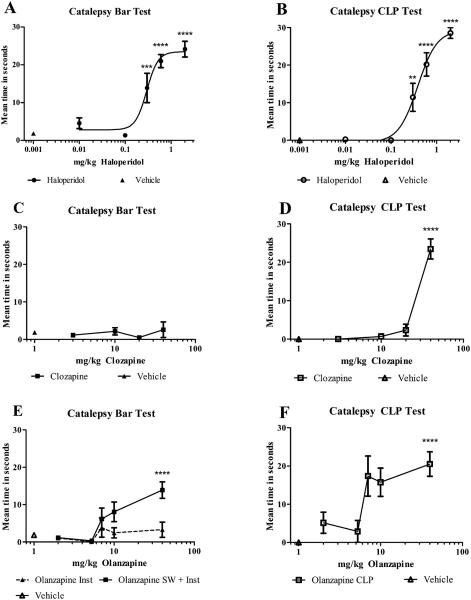
Figure 2 A-F.
Meantime in seconds in the bar test measured using the instrument (Inst) (graphs A, C, E), instrument plus stopwatch (SW + Inst) (graph E, solid line), or in the CLP test measured with a stopwatch (graphs B, D, and F). Graph A, haloperidol bar instrument, AED50 = 0.29 mg/kg. Graph B, haloperidol CLP, AED50 = 0.38 mg/kg. Graph C, clozapine bar instrument, no significant catalepsy. Graph D, clozapine CLP, significant catalepsy at 40 mg/kg. Graph E, olanzapine stopwatch + instrument (SW + Inst.), significant catalepsy at 40 mg/kg. Graph E, Inst. only, gripping problems prevented accurate detection of time on the bar. Dashed line shown only to illustrate problem. Graph F, olanzapine CLP, significant catalepsy at 40 mg/kg. n=7 rats/dose. Compared to vehicle, **, ***, and **** indicate p < 0.01, 0.001, and 0.0001 respectively.

