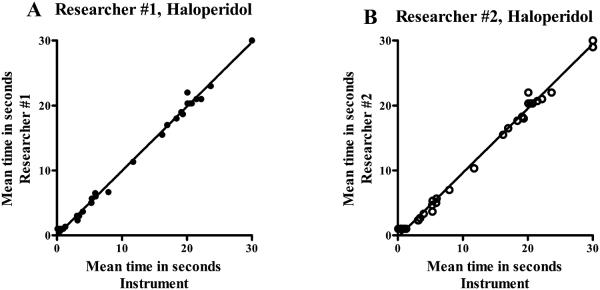
Figure 4 A-B.

Correlation between data obtained using the instrument and data obtained from researcher observations of video recordings for haloperidol using the bar test. The times (seconds) for 35 data pairs for graphs A and B, were evaluated. Correlation coefficients r = 0.9985 (graph A) and r = 0.9975 (graph B) were found, with a 2-tailed probability p < 0.0001 for all graphs (A, B).
