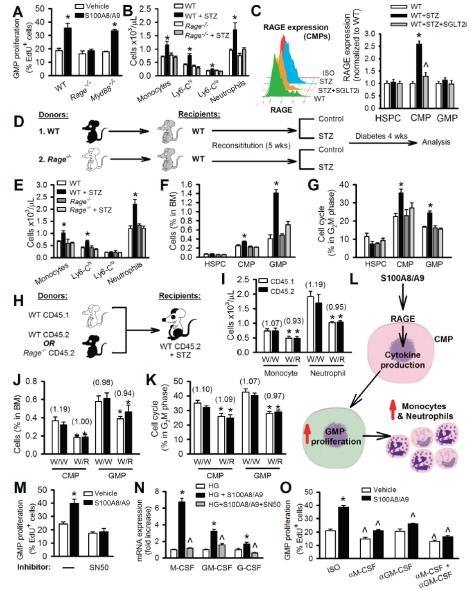
Figure 3.
RAGE on myeloid progenitor cells mediates S100A8/A9-stimulated leukocytosis in diabetic mice.
(A) GMP proliferation in response to S100A8/A9 (2μg/ml) as measured by EdU incorporation. n=4 independent experiments. *P<0.05 vs. vehicle in each respective genotype.
(B) Blood leukocyte levels in WT and Rage−/− mice with and without STZ-diabetes. n=5-6/group. *P<0.05 vs. all groups.
(C) Surface expression of RAGE on CMPs (histogram and quantification) in WT and STZ-diabetic mice treated with SGLT2i. n=6, *P<0.05 vs. all groups, *P<0.05 vs. WT+STZ. (D) Experimental overview: WT mice were transplanted with BM from WT or Rage−/− mice and made diabetic with STZ.
(E-G) After 4wks of diabetes, (E) blood leukocytes, (F) BM HSPC, CMP, GMP numbers and (G) proliferation measured by flow cytometry. n=5/group. *P<0.05 vs. all groups.
(H-L) Competitive BMT: (H) Experimental overview: Equally mixed portions of CD45.1 and CD45.2 BM from the respective genotypes were transplanted into WT CD45.2 recipients and made diabetic with STZ. (I) Numbers of CD45.1 and CD45.2 monocytes and neutrophils from the respective donor BM. (J) Percentage of CD45.1 and CD45.2 CMPs and GMPs and (K) percentage of CD45.1 and CD45.2 CMPs and GMPs in the cell cycle from each respective donor BM. Data are means ± SEM, n=5-6/group. Numbers in parentheses indicate ratio of CD45.1:CD45.2. *P<0.05 vs. W/W. (L) Scheme summarizing the cell extrinsic proliferative pathway induced by S100A8/A9-RAGE signaling.
(M) GMP proliferation in response to S100A8/A9 ± the NF-κB inhibitor (SN50, 20μM).
(N) mRNA of M-CSF, GM-CSF and G-CSF as quantified by qRT-PCR. n=4 independent experiments. *P<0.05 vs. all groups, ^P<0.05 vs. HG.
(O) GMP proliferation in response to S100A8/A9 ± neutralizing antibodies to M-CSF and/or GM-CSF or isotype controls (ISO) (all 30μg/ml). n=4 independent experiments.
*P<0.05 vs. ISO vehicle, ^P<0.05 vs. respective ISO control.
All values are means ± SEM.

