Fig. 1.
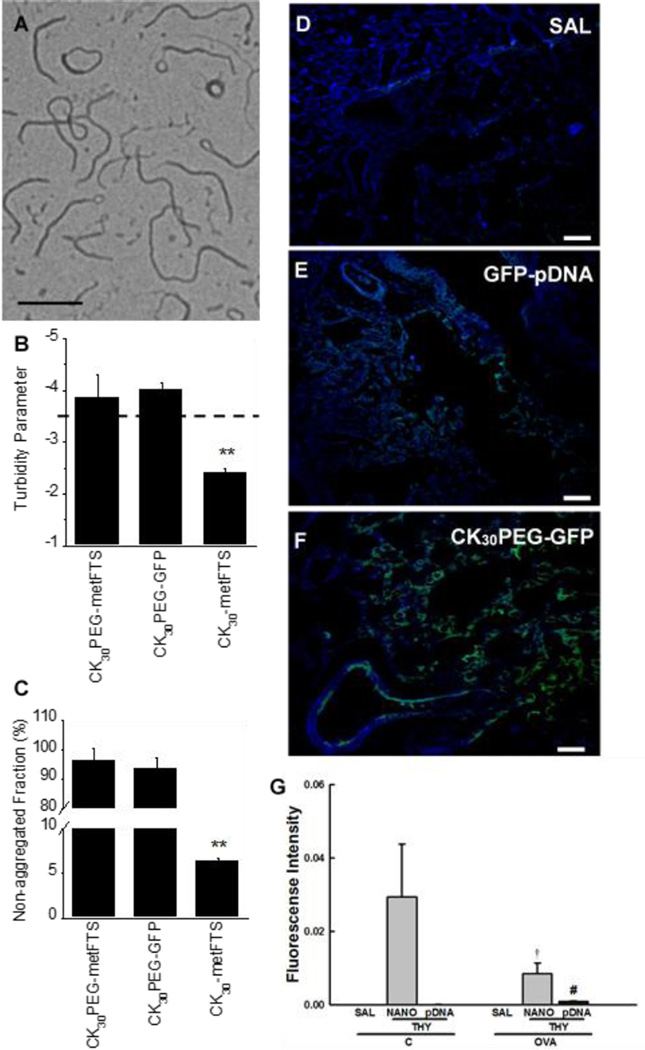
Physicochemical characterization of DNA nanoparticles. (A) TEM image of compacted DNA nanoparticles (CK30PEG-metFTS). Scale bar represents 200 nm. (B) Colloidal stability of compacted DNA nanoparticles in saline. Turbidity parameter is an indicator of colloidal stability. The parameter less than -3.5 (above the dashed line) indicates that particles are compacted and non-aggregated. (C) Non-aggregated fraction of compacted DNA nanoparticles as determined by the fraction of particle sedimentation. Data represents the mean ± SD. ** denotes statistical significant differences (P < 0.01) compared to other treatment groups. Confocal images of lung parenchyma of at 2 days post-administration of (D) saline (SAL), (E) naked GFP plasmid DNA (GFP-pDNA), and (F) DNA nanoparticles carrying GFP plasmid DNA (CK30PEGGFP) (100 µg plasmid DNA). Scale bars represent 100 µm. Note the presence of GFP expression (green) in lung parenchyma. (G) Real-time PCR-based quantification of thymulin plasmid in the lung tissues of saline sensitized/challenged control (C) and ovalbumin-sensitized/challenged (OVA) mice at 27 days post-administration of saline (SAL), thymulin plasmid DNA (THY; 100 µg plasmid DNA) as naked plasmid DNA (pDNA) or DNA nanoparticles (NANO). Higher SYBR green fluorescence intensity indicates larger plasmid DNA content. Data represents the mean ± SD (n = 5 mice per group). Differences are statistically significant (p < 0.01) from C-THY-NANO (†) or OVA-THY-NANO (#).

