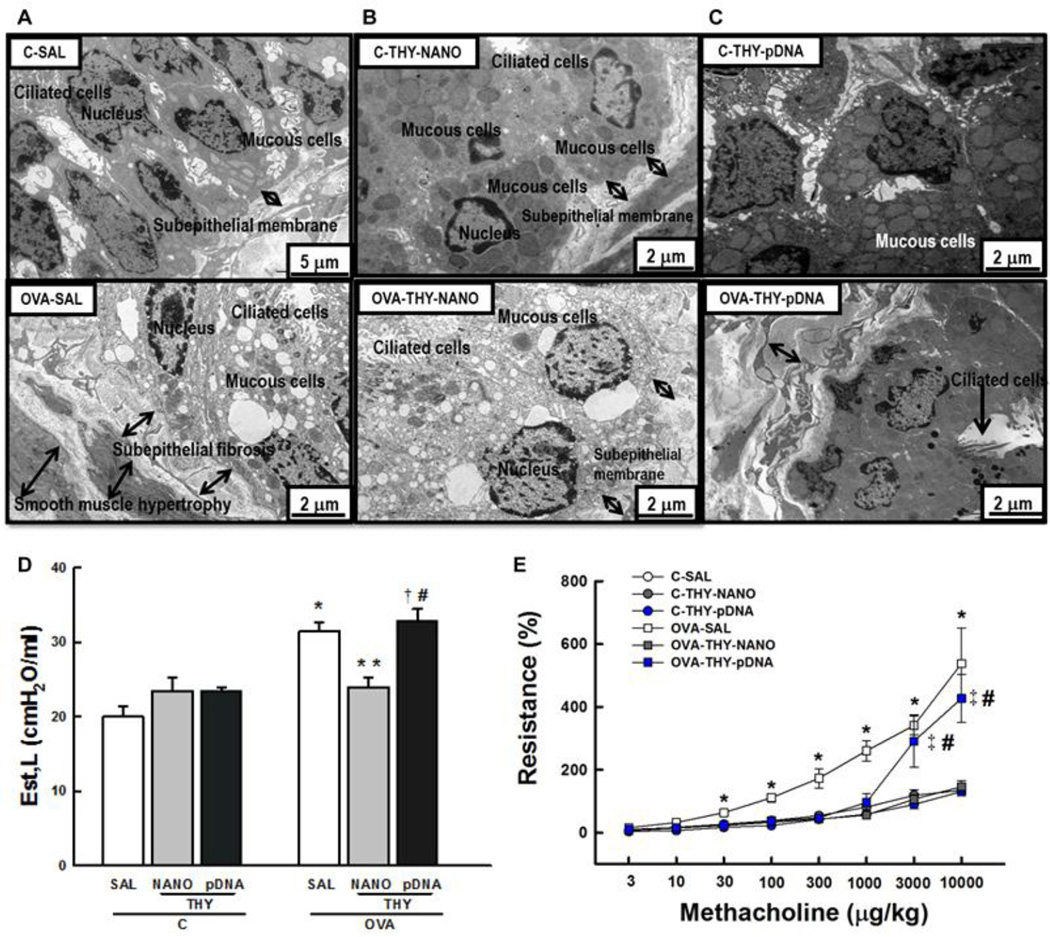
Fig. 5.
Lung ultrastructure and lung function. Electron microscopy of the lung of saline sensitized/challenged control (upper panel) and ovalbumin-sensitized/challenged mice (lower panel). Mice were intratracheally dosed with (A) saline, (B) DNA nanoparticles carrying thymulin plasmid DNA or (C) free thymulin plasmid DNA. (D) Lung static elastance (Est,L) and (E) airway hyperresponsiveness. Data represents the mean ± SD (n = 7 mice per group). C, mice sensitized/challenged with saline; OVA, mice sensitized/challenged with ovalbumin; SAL, mice treated with saline; THY-NANO, mice treated with DNA nanoparticles (100 µg plasmid DNA); THY-pDNA, mice treated with naked plasmid DNA (100 µg plasmid DNA). Differences are statistically significant (p < 0.05) from C-SAL (*), C-THY-pDNA (‡), OVA-SAL (**), or OVATHY- NANO (#).

