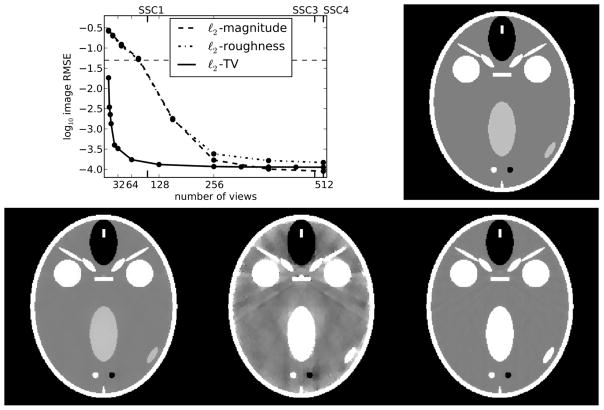
Fig. 11.
Top: Image RMSE, δ, for ℓ2-magnitude, ℓ2-roughness, and ℓ2-TV reconstructions, as in Fig. 6, except that the data are generated from the head phantom shown on the right. The labels SSC1, SSC3, and SSC4 are the sufficient-sampling conditions discussed in Section IV-A. Bottom: images reconstructed for Nviews = 12 shown in a gray scale window of [0.9, 1.1] on the left and a narrow gray scale window of [0.99, 1.01] in the middle. On the right is the reconstructed image for Nviews = 32 in the narrow gray scale window [0.99, 1.01]. At Nviews = 12 the RMSE is 0.005 resulting in visible artifacts for the image shown in the 1% gray scale window, while the RMSE is a factor of 10 less for Nviews = 32.

