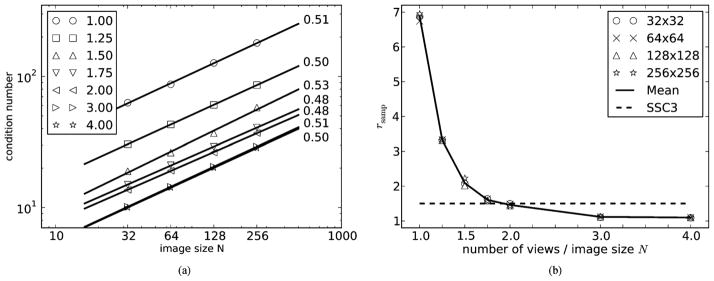
Fig. 3.

Left: condition numbers as function of image size. Each symbol represents different number of views ranging from N to 4N. Circular image arrays are used with sizes given by N = 32, 64, 128, 256. The number of bins is fixed at 2N. With each number of views is also shown the best linear fit and its slope is given. In all cases the condition number scales with . Right: same condition numbers normalized by the respective κDC at each N and plotted as function of view number normalized by image size N. The full line is the point-wise mean and the dashed line is the position of SSC3 with rsamp = 1.5. Independently of N, SSC3 with rsamp = 1.5 occurs very close to Nviews = 2N.
