
Table 4.
Sequential changes in HOMA-IR and HOMA-β relative to treatment response in patients with a high baseline HOMA-IR (HOMA-IR >2.5; n=27 for SVR, n=11 for non-SVR)
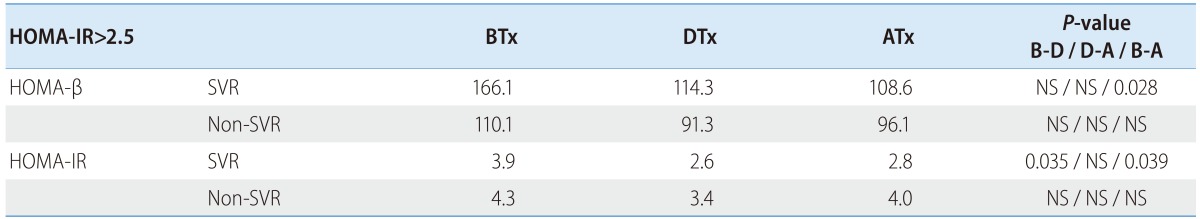
B-D, differences between BTx and DTx; D-A, differences between DTx and ATx; B-A, differences between BTx and ATx; BTx, Before treatment; DTx, End of treatment; ATx, After treatment; HOMA-β, homeostasis model assessment of β cell; HOMA-IR, homeostasis model assessment of insulin resistance; SVR, sustained virologic response; NS, not significant.