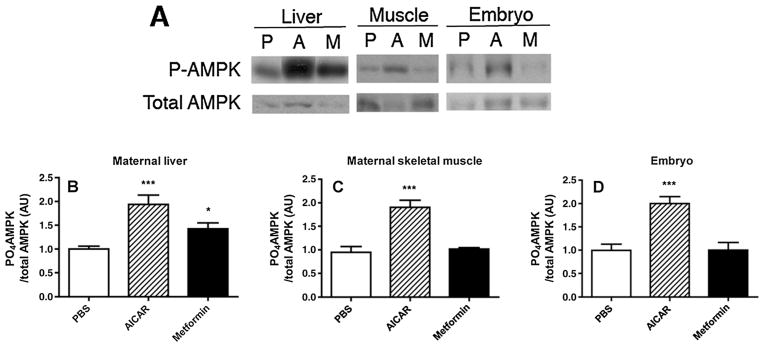
Figure 1.

(A) Representative immunoblots of phospho-adenosine monophosphate-activated protein kinase (AMPK) α (Thr172) (P-AMPK) and total AMPK using protein extracted from maternal liver, maternal gastrocnemius muscle or embryos following administration of phosphate-buffered saline (PBS) (P), 50 mg/kg 5-aminoimidazole-4-carboxamide-1-beta-4-ribofuranoside (AICAR) (A) given at noon on E 7.5 or 40 mg/kg metformin (M) given three times/day from E 0.5 to 7.5. Embryos or maternal tissues were recovered for assay of activated AMPK 90 min after PBS or AICAR injections. (B) Quantitation of P-AMPK/total AMPK of liver of pregnant mice on E 7.5 treated as in panel (A). n = 6 for each treatment group. ***p <0.001 versus PBS; *p <0.05 versus PBS, AICAR. (C) Quantitation of PO4-AMPK/total AMPK of gastrocnemius muscle of pregnant mice on E 7.5 treated as in panel (A). n = 5 for each treatment group. ***p <0.001 versus PBS, metformin. (D) Quantitation of P-AMPK/total AMPK of E 7.5 embryos of mice treated as in panel (A). n = 6 for each treatment group. Band intensity is expressed as arbitrary units (AU) relative to PBS. ***p <0.001 versus PBS, metformin
