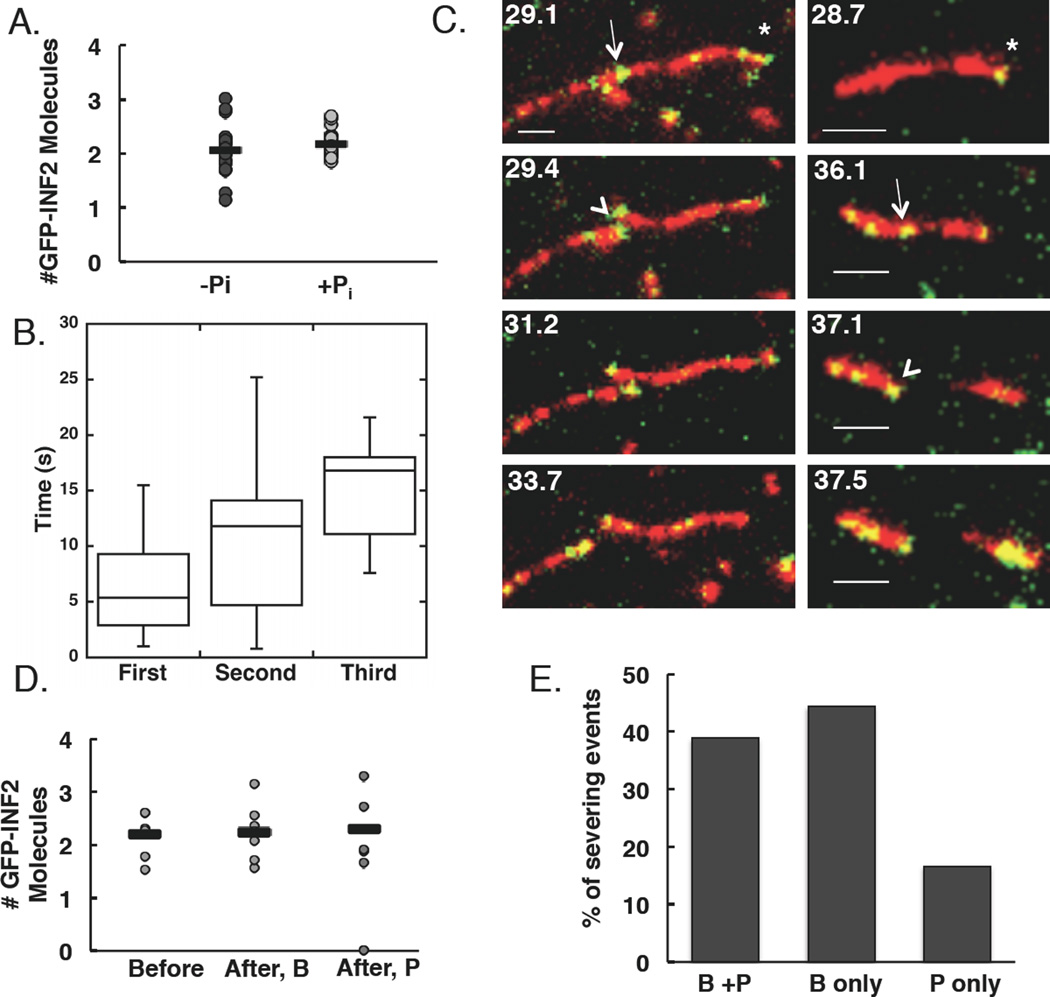
Figure 3. INF2 binds filament sides as single dimers and severs at binding sites.
(A)Number of GFP-INF2-FFC molecules localized at diffraction-limited puncta (n=28 and 25 puncta (8 and 6 filaments) in the absence and presence of phosphate respectively). Averages (bars) are 2.06 and 2.17 molecules in the absence and presence of phosphate respectively.
(B) Box and whisker quantification of severing time after punctum binding for first, second, and third severing events. Line indicates mean, box represents values 25–75% of totals, whiskers indicate full range of values. n= 14, 9, and 5 events.
(C) Two examples of severing at sites where an apparent single GFP-INF2-FFC dimer (green) is bound to TAMRA-actin (red). Asterisk indicates barbed end, arrow indicates punctum correlated with severing, arrowhead indicates severing event. Left panels: GFP-INF2 puncta present at both new barbed and pointed ends after severing. In right panels: GFP-INF2 punctum only at new barbed end after severing. Scale bar 2 µm. Corresponds to Movies 5 and 6.
(D)Distribution of GFP-INF2-FFC localization after severing for events occurring at sites where two GFP-INF2-FFC were located prior to severing. After, B = new barbed end. After, P = new pointed end. Bars represent averages from 7 events. Note: two events result in punctum localization at only new barbed end.
(E) Localization of puncta after a severing event with respect to newly created barbed or pointed ends. All severing events included, regardless of the number of GFP-INF2-FFC molecules present before the event. n=18 filaments.

