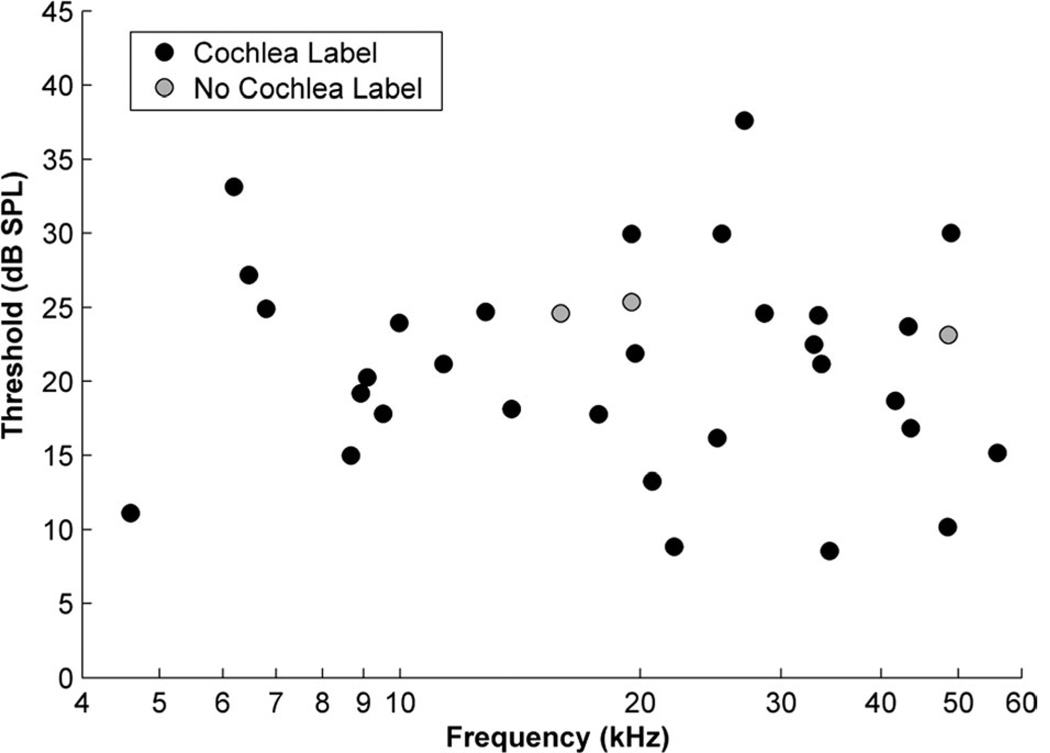
Figure 1.
Plot of thresholds and best frequencies of multiunit auditory responses in the cochlear nucleus of CBA/J mice. Two groups of unit clusters are shown: those for which an injection was made and successfully traced to the cochlea (black circles) and those for which an injection was made but no label was found in the cochlea (gray circles).

