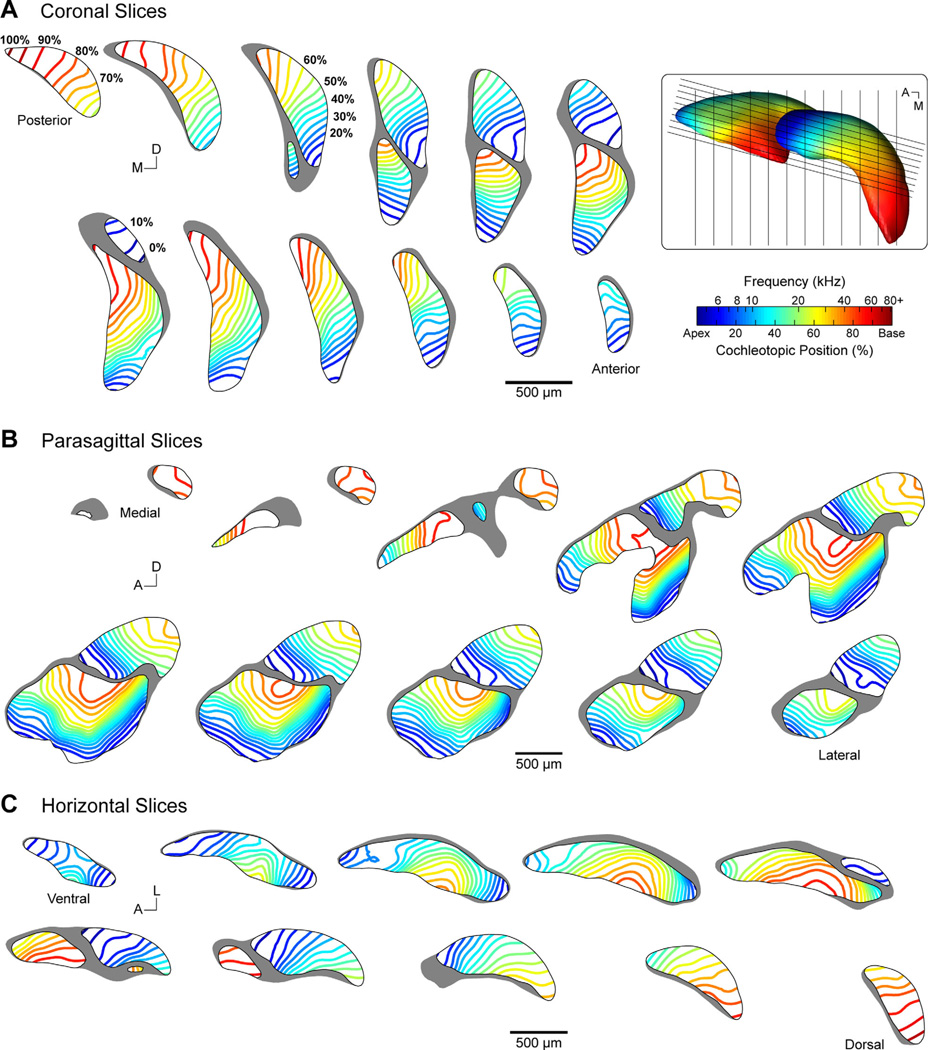
Figure 10.
Collection of virtual slices demonstrating tonotopy in the cochlear nucleus of the CBA/J mouse. Evenly spaced parallel slices are presented in coronal (A), parasagittal (B), and horizontal (C) planes. Isofrequency lines are rendered within each slice at 5% cochleotopic intervals, equivalent to 0.21-oct. steps, and correspond to the isosurfaces presented in B. Frequency and cochleotopic values are interchangeable based on our place-frequency map of the cochlea (Fig. 3). Slices in each row or column are aligned with one another along the orthogonal axis. Coronal and horizontal slices are spaced at 150 µm. Parasagittal slices are spaced at 50 µm and oriented 15° off the sagittal plane. Inset: Dorsal view of the 3D model. Black lines indicate the location of sectioning planes used for virtual slicing of coronal and parasagittal sections. Horizontal sections are taken along the plane of the image.

