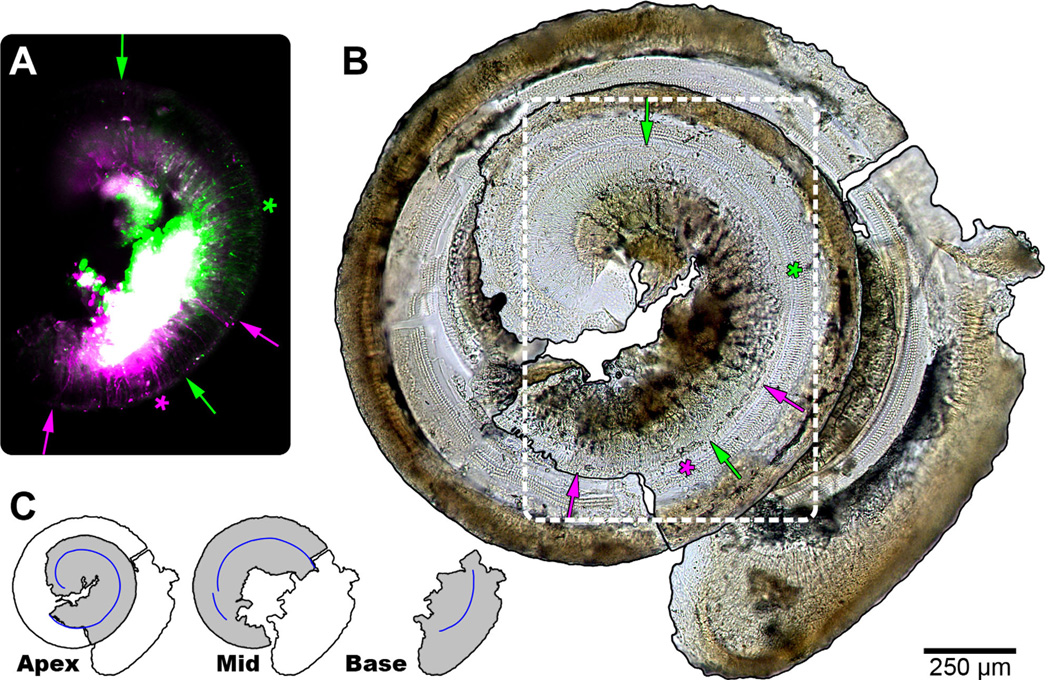
Figure 2.
Summary of cochlear analysis. A: Composite fluorescent micrograph of the apical turn of a cochlea (#30; Table 1), corresponding to white dashed outline in B. Auditory nerve fibers labeled with either rhodamine (magenta) or fluorescein (green) are present. The large white region corresponds to the intense and unfocused signal from SGCs overlapping in both channels. Labeled radial fiber processes that reach to the IHCs were analyzed. The apical and basal extent of labeling of each tracer is indicated using arrows of matching color. The calculated midpoint of labeling is shown with asterisks. B: Photomontage of the osseous spiral lamina and basilar membrane of the dissected cochlea. A single row of IHCs and three rows of outer hair cells are evident. Arrows and asterisks as in A. C: Schematic representation of the separate apical, middle, and basal segments recovered from a cochlea and reconstructed in B. The pieces were arranged to resemble the spiral of the intact cochlea. The total measured extent of the row of IHCs is shown by the blue line segments. Scale bar = 250 µm in A–B.

