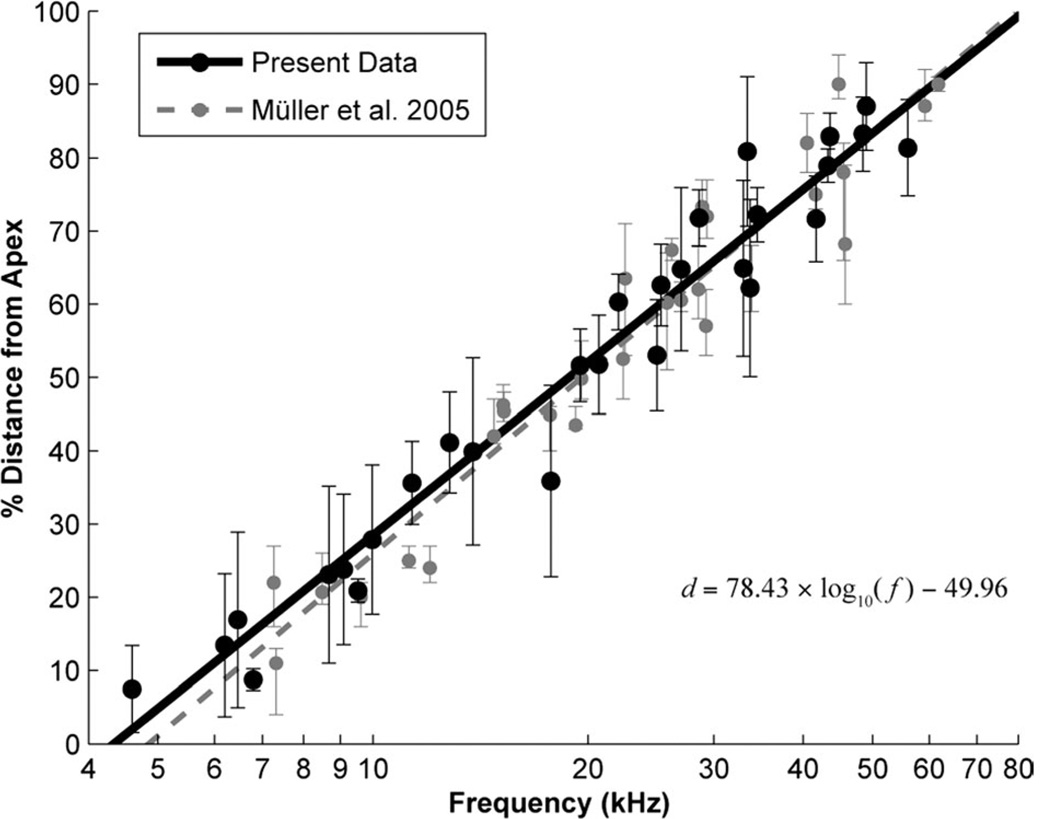
Figure 3.
Plot of cochlear place-frequency map for the CBA/J mouse. The place-frequency map was constructed by comparing the locations of labeled fibers in the cochlea (Fig. 2) to the best frequency of the injection site (Fig. 1). The midpoint of label (black circles) and the spread of labeling along the cochlea (vertical bars) are shown. A log-linear line of best fit was calculated (black solid line) and takes the form d = 78.43 × log10 (f) − 49.96 (R2 = 0.96), where f is the frequency in kHz and d is the normalized percent distance from the apex in the cochlea. For comparison, the individual measurements (gray circles/bars) and log-linear fit (gray dashed line) from Müller et al. (2005) are also shown. The equation for the Müller fit is d = 82.5 × log10 (f) − 56.5. The correspondence of the plots is striking considering the different methods utilized.

