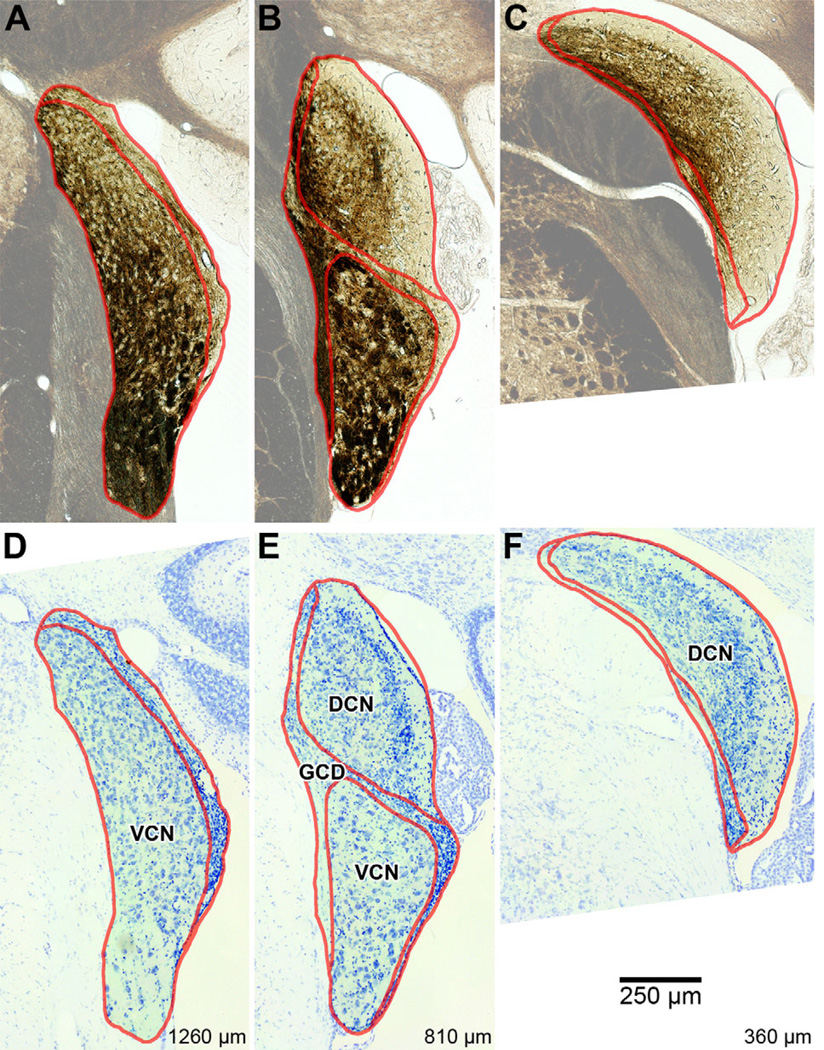
Figure 4.
Photomicrographs of three evenly spaced coronal sections through the right cochlear nucleus of a CBA/J mouse (#60R; Table 2). Borders delineating the major subdivisions of DCN, VCN, and GCD are shown in red. Regions outside the CN were rendered semiopaque for emphasis. A–C: Photomicrographs of unstained sections. Areas rich in myelin appear dark brown. Values at bottom-right designate relative distance from the posterior edge of the CN. D–F: Photomicrographs of the same sections after staining with cresyl violet, showing cytoarchitecture.

