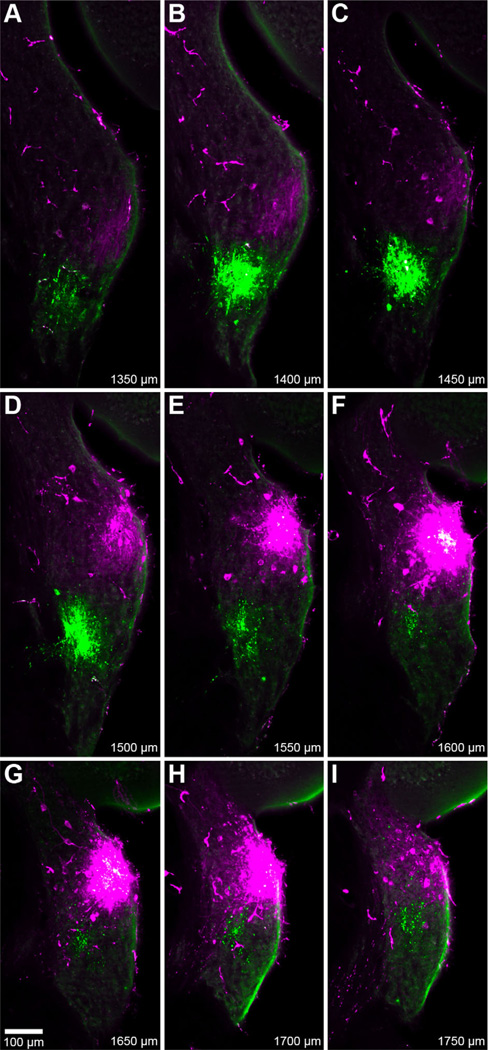
Figure 6.
Fluorescent photomicrographs of serial coronal sections, 50-µm thick, spanning a pair of cochlear nucleus injection sites (#30; Table 1). Both rhodamine (magenta, 11.3 kHz BF) and fluorescein (green, 9.1 kHz BF) injections were located in the AVCN. The most intense central region of rhodamine labeling was also detected with fluorescein filters, resulting in white pixels (e.g., panel F). Values at bottom-right designate relative distance from the posterior pole of the CN. The location of the rhodamine injection is both more dorsal and anterior to that of the fluorescein injection. Faint strands of labeled AN fibers can be found posteroventral to each injection.

