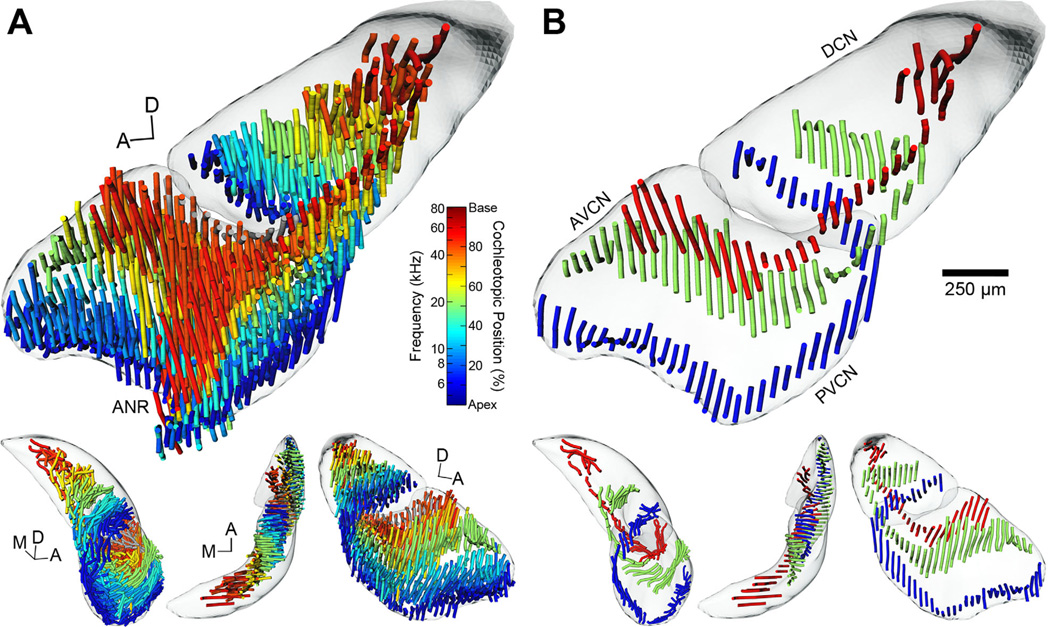
Figure 8.
3D tonotopic arrangement of auditory nerve fibers in the cochlear nucleus of the CBA/J mouse. A: The complete set of reconstructed AN fiber tracts from all experimental cases is shown after normalization to the template CN. Each tract is represented as a set of “noodles” and shaded according to its position of cochlear origin. Equivalent frequency/position values are provided (vertical color map) based on our place-frequency map of the cochlea (Fig. 3). A clear tonotopic trend is evident in all three major subdivisions. DCN and VCN surfaces are also shown and rendered semiopaque. The top figure is from a medial viewpoint. Lower figures are from alternate viewing angles; L-R: posterior, dorsal, and lateral. In the lower figures, the reconstructed ANR fibers have been removed (see text). B: Three cases from A are chosen to illustrate the trajectory of low-, middle-, and high-frequency AN fiber tracts more clearly. Examples shown correspond to values of 13.5%/6.4 kHz, 53.0%/20.5 kHz, and 87.0%/55.8 kHz. The reconstructed ANR fibers have been removed. Scale bar = 250 µm for large figures only.

