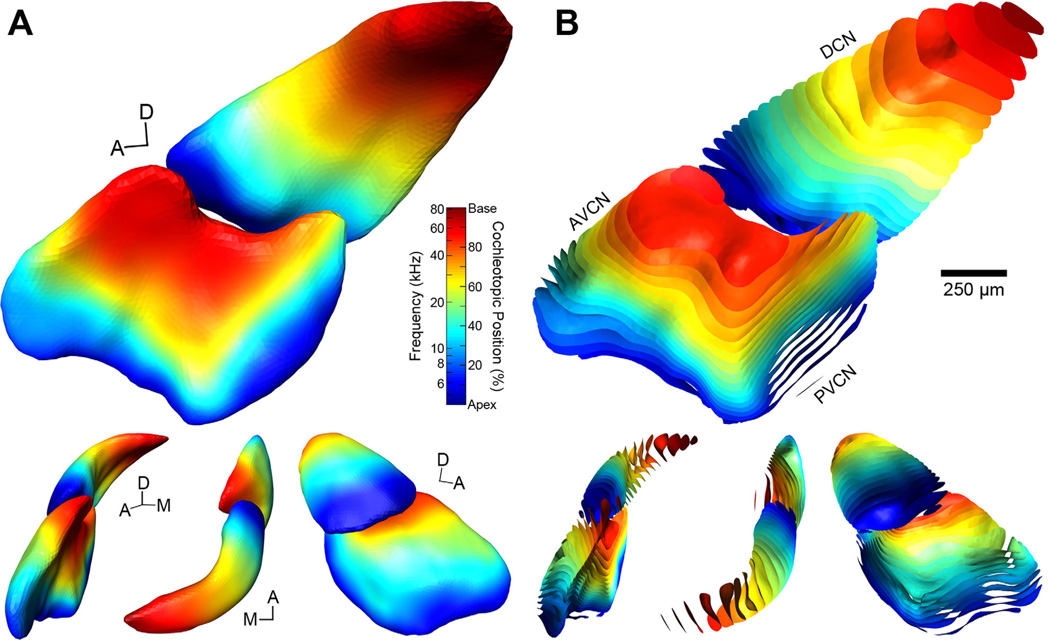
Figure 9.
3D models of frequency representation in the cochlear nucleus of the CBA/J mouse. A: Volumetric DCN and VCN models constitute the predicted values of frequency representation at any coordinate. The exterior nodes of the DCN and VCN surfaces were shaded according to their predicted values. Frequency and cochleotopic values are interchangeable based on our place-frequency map of the cochlea (Fig. 3). Within the bounds of each subdivision, the model captures the trends found with respect to the tonotopic organization of auditory nerve fibers (Fig. 8). B: Isosurfaces constrained to subdivision boundaries are rendered for cochleotopic values at 5% intervals, corresponding to 0.21-oct. steps, and shaded accordingly. Viewed in this manner, we are able to observe the undulations of isofrequency laminae within the interior of the CN. The top figures are from medial viewpoints. Lower figures are from alternate viewing angles; L-R: anterior, dorsal, and lateral. Scale bar = 250 µm for large figures only.

