
Figure 1.
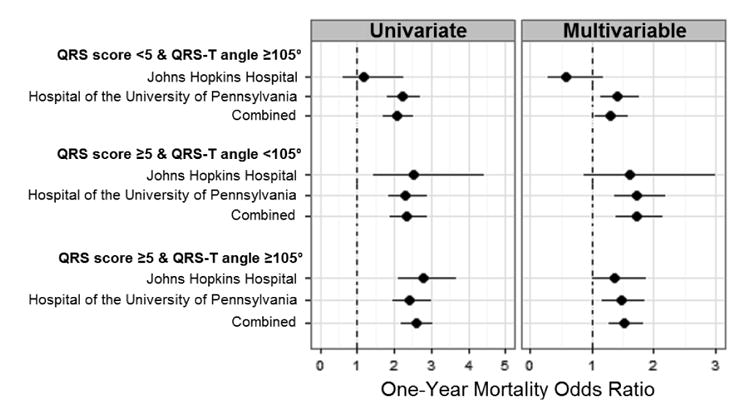
Forest plot of univariate and adjusted odds ratios for combinations of QRS score ≥5 and/or QRS-T angle ≥105° compared to not meeting either threshold. Data are shown for each hospital alone and for the two hospitals combined. Multivariable models are adjusted for age, gender, chronic renal impairment and heart rate. See Table S3 for the exact point estimates and 95% confidence intervals.