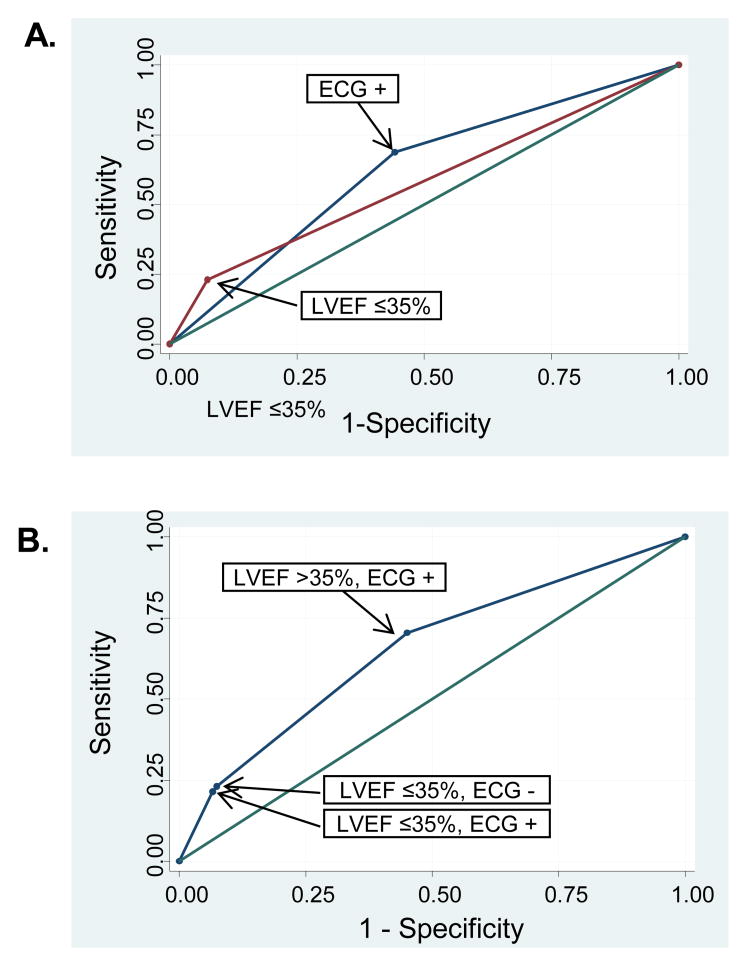
Figure 2.
ROC curves for LVEF ≤35% and ECG (combination of QRS score ≥5 and QRS-T angle ≥105°) to discriminate the risk of death. (A) Individual ROC curves for LVEF ≤35% (AUC=0.57 [0.55-0.60]) and for ECG (AUC=0.62 [0.59-0.65]). (B) ROC curve from the model combining LVEF and ECG (AUC=0.65 [0.62-0.69]). There was an increase in AUC from LVEF alone to LVEF+ECG (p<0.0001). This was driven by an increase in sensitivity for the ECG to detect patients with increased risk of death in patients with LVEF >35%.

