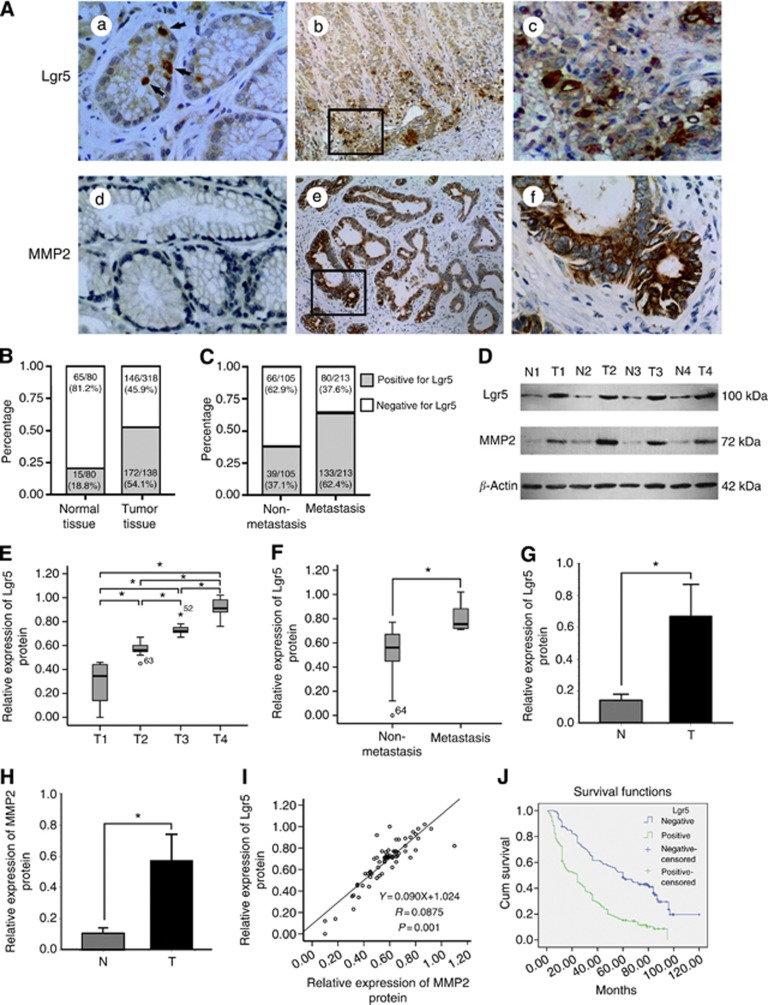
Figure 1.
Analysis of Lgr5 and MMP2 in human gastric carcinoma and normal tissues. (A) Expression of Lgr5 and MMP2 was determined by immunohistochemical staining. Lgr5 was predominantly expressed in the cytoplasm. (a) Single epithelial cells were Lgr5-positive in normal tissue (arrows). (b and c) Carcinoma cells at the invasive front exhibit strong positive staining (asterisks). (d) Lack of MMP-2 expression in normal tissues. (e and f) MMP-2 staining in the cytoplasm of tumour cells. (a, c, d, and f: × 400 magnification; b and e: × 100 magnification). (B) The distribution of Lgr5 in 318 tumour or 80 normal tissue specimens was analysed. The proportion of Lgr5-positive cells in gastric cancer tissues was much higher than that in normal tissues. (C) The tumour specimens were divided into two groups according to whether cancer patients had tumour metastasis (including lymph node metastasis and distant metastasis). The percentage of specimens positive for Lgr5 were analysed. (D) Representative immunoblots of Lgr5 and MMP2 protein expression in whole tissue extracts from paired samples of gastric cancer tissue (T: tumour) and adjacent normal tissue (N: normal). β-Actin was used as the loading control. (E and F) Box and Whisker plots showing the distribution of Lgr5 proteins, as assessed by western blotting, in gastric cancer tissues according to the degree of tumour infiltration (T stage) and tumour metastasis status. Extremes and outliers are identified by ‘o' and ‘*', respectively. (E) Mean Lgr5 protein levels at T1, T2, T3, and T4. Lgr5 protein expression increased stepwise with T-stage progression (*P=0.001). (F) Leucine-rich repeat-containing G-protein-coupled receptor 5 protein expression was enhanced in metastasising tumours compared with non-metastatic cancer tissue (*P=0.001). (G and H) Comparison of Lgr5 and MMP2 protein expression levels between gastric cancer and normal tissues. Leucine-rich repeat-containing G-protein-coupled receptor 5 and MMP2 protein expression levels were higher in cancer tissues than those in adjacent normal mucosa (*P=0.001). Values are presented as the mean±s.d. (I) Correlation between Lgr5 and MMP2 protein expression levels in gastric cancer were analysed by Pearson's correlation test and linear regression. Each protein was quantified by determining the intensities of the band compared with that of β-actin. There was a positive correlation between Lgr5 and MMP2 levels (r=0.947, *P=0.014). (J) Kaplan–Meier survival curves for survival duration in patients with gastric cancer according to Lgr5 expression levels. Leucine-rich repeat-containing G-protein-coupled receptor 5-positive patients had significantly shorter survival durations than Lgr5-negative patients, as assessed by the log-rank test (P=0.001).

