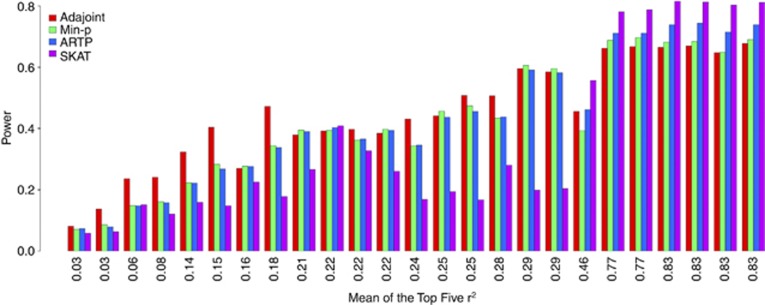
Figure 4.
Power comparison based on simulations conducted at gene MYO9B. Each bar corresponds to the case where the only causal SNP is excluded from the samples and the five tests aggregate the signals from the remaining SNPs. The odds ratio of the causal SNP is chosen such that the power of its 1-df score test is 0.9 under the level 0.05, given its MAFs and 3000/3000 case-control sample sizes. The number under the bar is the mean of the top five r2's measured between the designated causal SNP and each of the other 24 SNPs.

