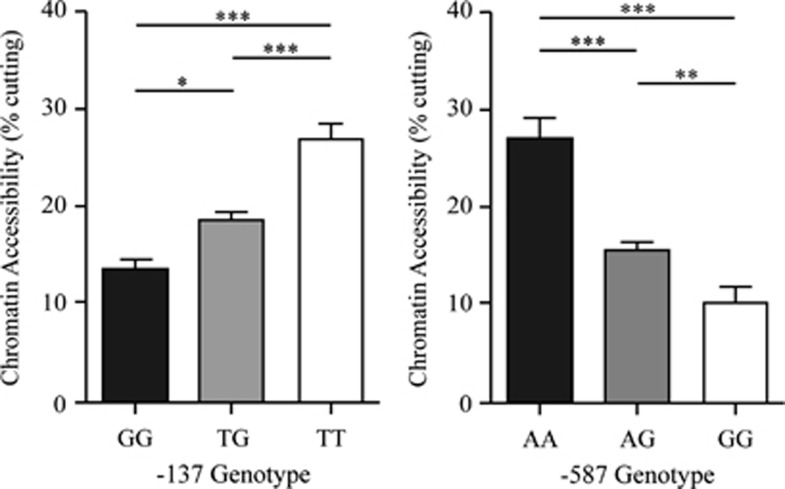
Figure 3.
Chromatin accessibility differences at the −137 and −587 SNPs. MNase-treated cell lines of the genotypes shown were used to calculate chromatin accessibility expressed as a ratio of undigested/MNase digested (percentage of cutting). The data were obtained from five different cell lines for each genotype assayed in triplicate. Significance was determined by the Student's t-test. Error bars represent mean±SEM, *P<0.05, **P<0.005, ***P<0.001.

