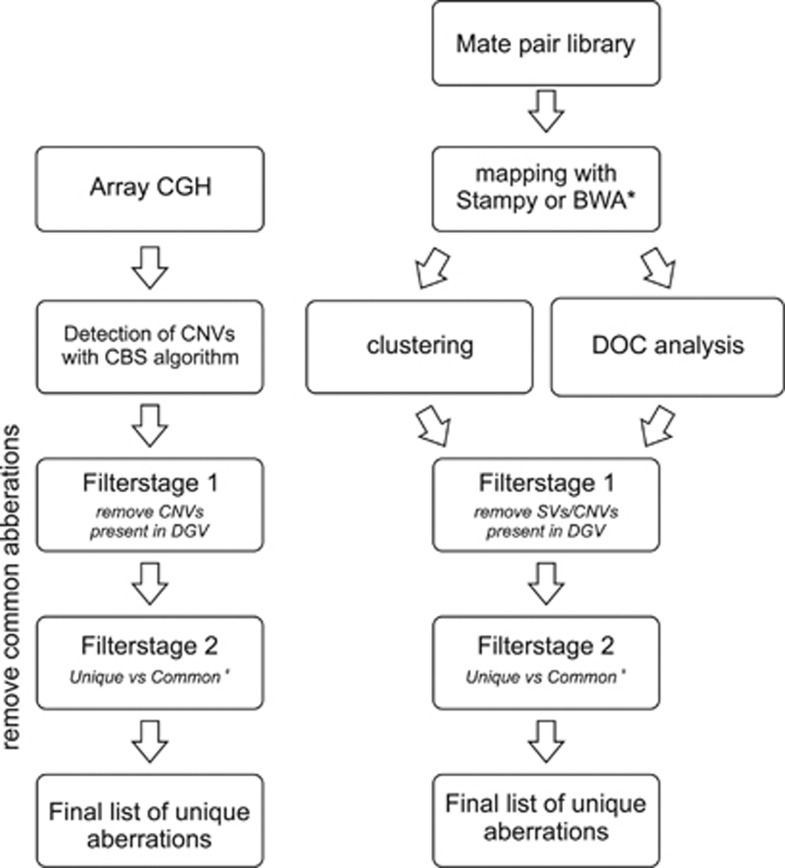
Figure 1.
Flowchart of the analysis of the array CGH, cluster and coverage analysis data. Two main filtering steps were used: comparison with DGV followed by a comparison of the remaining aberrations to the aberrations detected in the patient pool (#). Stampy and BWA were, respectively, used for Illumina and SOLiD data (*).

