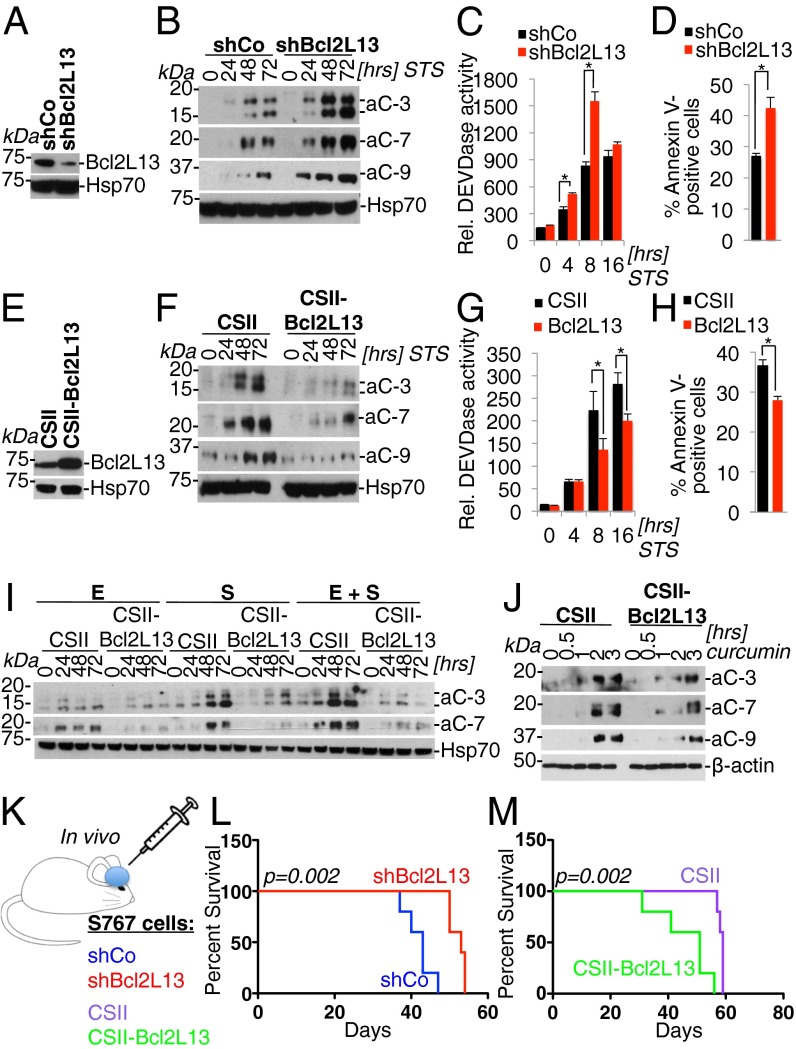
Fig. 2.
Bcl2L13 potently inhibits therapy-induced apoptosis and promotes GBM progression in vivo. (A) Lentivirus-mediated knockdown of Bcl2L13 using a Bcl2L13-targeting shRNA (shBcl2L13), as assessed by Western blot analysis for endogenous Bcl2L13. Heat shock protein 70 (Hsp70) is shown as a loading control. (B) Western blot analysis for active effector caspases in cells with stable knockdown of Bcl2L13 treated with STS (100 nM). aC-3, active caspase-3; aC-7, active caspase-7; aC-9, active caspase-9. (C) Quantification by fluorometric DEVDase assay using a fluorochrome-labeled DEVD peptide of effector caspase-3 and -7 activity induced by STS (100 nM). (D) FACS-based annexin V quantification of cells harboring shCo and shBcl2L13 following treatment with STS (100 nM) for 24 h. (E) Lentivirus-mediated, enforced Bcl2L13 overexpression in SF767 cells. Shown is a Western blot for Bcl2L13; Hsp70 is shown as a loading control. (F) Effect of enforced Bcl2L13 expression on STS-induced (100 nM) apoptosis as documented by Western blot analysis for active caspase -3, -7, and -9. (G) DEVDase assays of SF767 cells ectopically expressing Bcl2L13. (H) FACS-based quantification of annexin V-positive cells following treatment with STS (100 nM) for 24 h. (I) Antiapoptotic activity of enforced Bcl2L13 in SF767 cells upon EGFR and c-Met inhibition by erlotinib (E, 5 μM) and SU11274 (S, 5 μM)], either singly or in combination, as measured by caspase-3 and -7 cleavage. (J) Inhibition of curcumin-induced (50 μM) apoptosis by enforced Bcl2L13 expression in SF767 cells as measured by Western blot analysis for active caspase-3, -7, and -9. β-Actin is shown as a loading control. (K–M) A GBM xenograft model (K) to determine the impact of stable Bcl2L13 knockdown (SF767 cells) (L) or Bcl2L13 overexpression (M) on GBM progression. Shown are Kaplan–Meier survival curves of xenografts harboring glioma cells with enforced Bcl2L13-targeting shRNA or Bcl2L13 cDNA expression. In C, D, G, and H, results are shown as mean ± SD; *P < 0.05.

