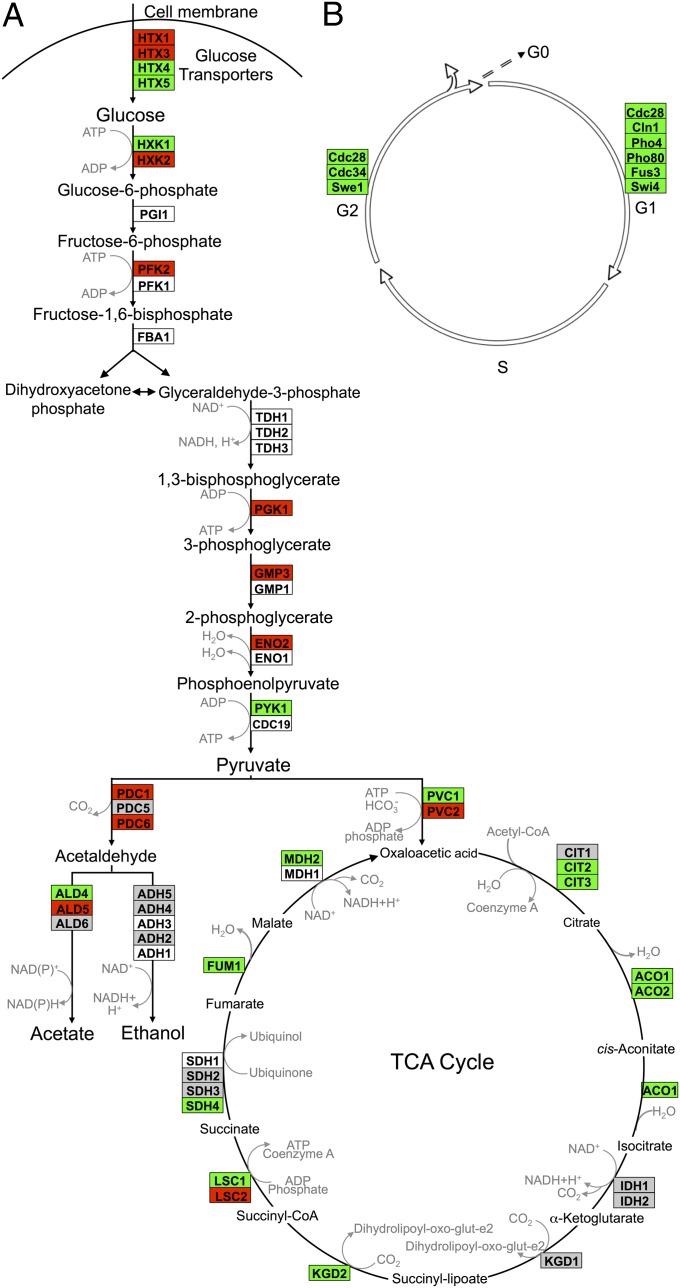
Fig. 3.
Comparison of gene expression in immobilized relative to planktonic yeast: (A) intermediary metabolism and (B) cell cycle. Differentially expressed transcripts identified using GeneSpring were overlayed onto the S. cerevisiae KEGG biological pathway maps using GenMapp software. Detailed KEGG pathway cell cycle results are presented in Fig. S5. Transcript levels in immobilized well-fed yeast for days 3, 5, 10, and 17 were averaged across replicate experiments. Red indicates instances where those values were at least twofold greater in immobilized cells than in planktonic cells. Green indicates instances where those values were at least twofold less in immobilized cells than in planktonic cells. White indicates that the gene was not found among the significant gene list identified earlier using GeneSpring. Gray denotes instances where transcript levels differed by less than twofold.

