Fig. 2.
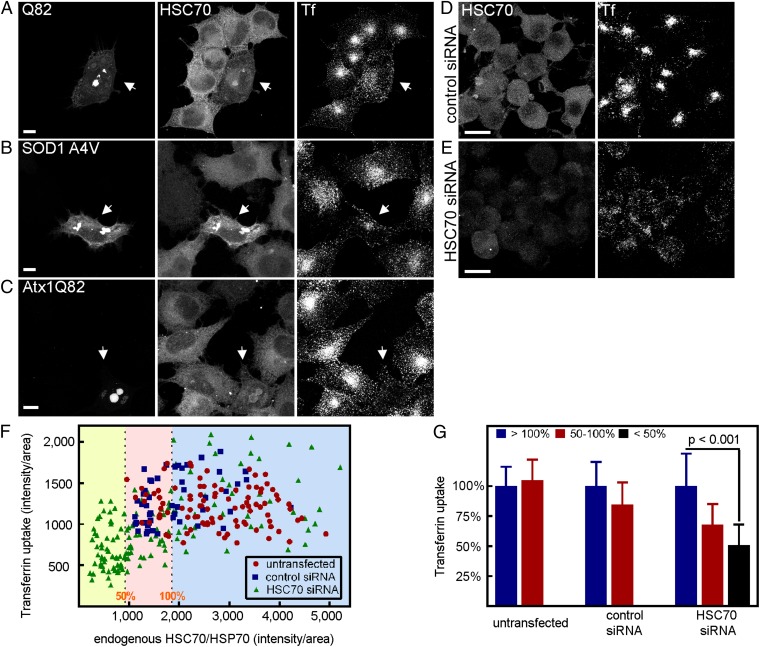
Depletion of HSC70 by protein aggregate relocalization or by RNAi inhibits CME. (A) PC-3 cells transiently expressing Q82-EGFP (Left) were assayed for internalized Alexa555-transferrin (Right) and endogenous HSC70 localization (Center). HSC70 was detected using specific antibodies by indirect immunofluorescence. Arrows point to an aggregate-containing cells. Note that the diffuse pool of HSC70 appears reduced in this cell. (Scale bar, 10 μm.) (B) As in A, but in PC-3 cells expressing mutant SOD1 (A4V)-AcGFP. Arrows point to an aggregate-containing cells. (C) As in A, but in PC-3 cells expressing EGFP-Atx-1 Q82. Arrows point to an aggregate-containing cells. Neuro2a cells transfected with control (D) or specific siRNAs targeting HSC70 (E) were assayed for Alexa555-transferrin internalization (Right) and immunostained for endogenous HSC70 (Left). Note the decreased levels of HSC70 and corresponding low transferrin levels in E. (F) Quantification of internalized transferrin levels in Neuro2a cells that were untransfected or transfected with control or HSC70 siRNA oligonucleotides. Shown are the relative HSC70 expression level values of individual cells plotted against their corresponding internalized transferrin fluorescence values as calculated in G. The plot background has been divided into three sections based on relative HSC70 levels normalized to the average of the control siRNA cells (yellow, <50%; pink, 50–100%; and blue, >100%) to show the number of cells that fall into each category. The three binned categories are those depicted in G. (G) Quantification of internalized transferrin levels in Neuro2a cells that were untransfected or treated with control or HSC70 siRNA oligonucleotides. Cells were grouped into three categories based on relative HSC70 expression levels and normalized to that of control siRNA transfected cells. Internalized transferrin fluorescence was analyzed as in Fig. 1. Shown are mean values of transferrin levels with error bars representing SDs. P values were determined using a Student t test.

