Fig. 5.
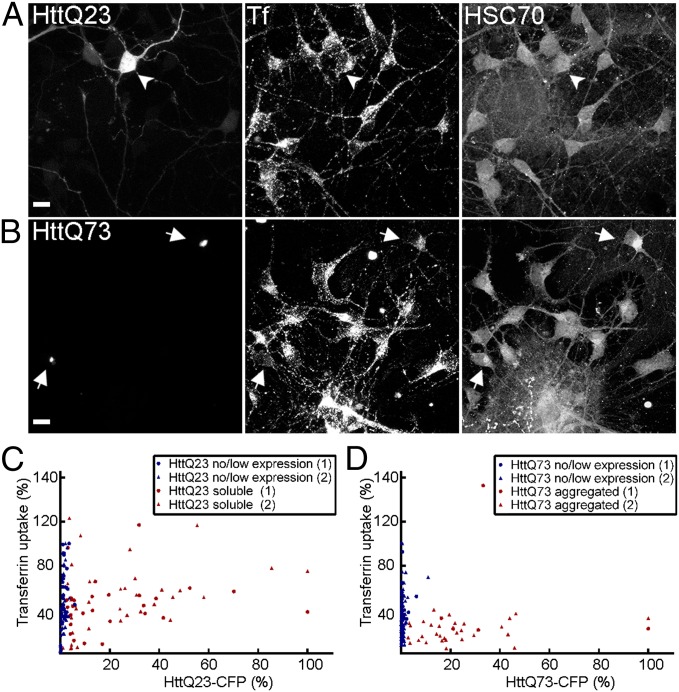
HSC70 recruitment to HttQ73 aggregates in primary CNS neurons is accompanied by inhibition of CME. Primary corticostriatal neuronal cocultures were nucleofected to express either Htt exon 1 Q23-CFP (A) or Htt exon 1 Q73-CFP (B), assayed for Alexa555-transferrin internalization, and immunostained for endogenous HSC70 localization. Images shown are maximal projections of a z-series of fluorescence confocal slices through the entire cell volume. In B, note that HSC70 colocalizes with Htt Q73 aggregates (arrows) and that neurons expressing these aggregates show reduced levels of transferrin uptake. Arrowheads and arrows point to neurons expressing HttQ23 or aggregated HttQ73 in A and B, respectively. (Scale bar, 10 μm.) (C) Scatterplot of fluorescence quantification of internalized transferrin as related to Htt exon 1 Q23-CFP levels, as in Fig. 1D, in individual primary neurons. Neurons were grouped into nonexpressing vs. expressing categories. Both transferrin and CFP fluorescence were normalized to the highest values of the no expression control and CFP-expressing cells, respectively, and data from two imaging trials (labeled as 1 and 2) of the same sample were plotted. (D) As in C, except for neurons expressing Htt exon 1 Q73-CFP. Neurons were grouped into nonexpressing/low soluble expression vs. aggregated categories.

