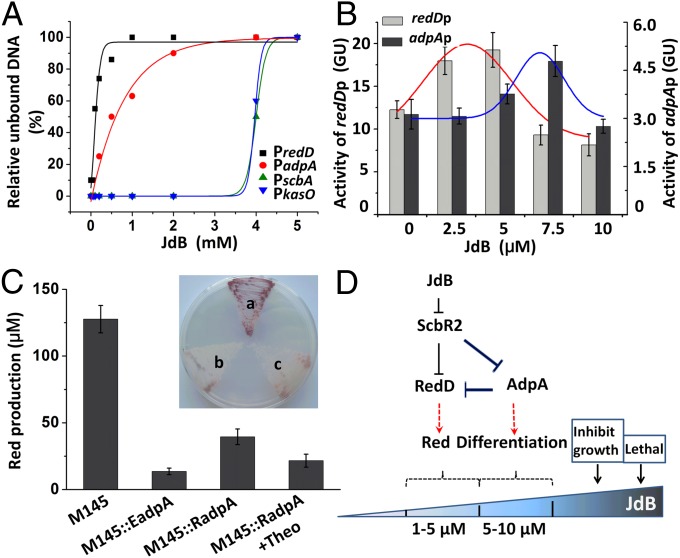
Fig. 5.
The feed-forward loop controlling different behaviors of S. coelicolor M145 in respond to different concentrations of JdB. (A) Dissociation curves of ScbR2–DNA complexes in response to JdB. The concentrations of JdB used were 0, 0.05, 0.1, 0.2, 0.5, 1, 2, 4, and 5 mM. Black squares, red closed circles, green triangles, and blue triangles represent the estimated relative unbound DNA of the PredD, PadpA, PscbA, and PkasO probes, respectively. (B) The activities of redDp and adpAp at different concentrations of JdB reported by the gusA reporter gene. Values are means and SDs from triplicate cultures. The trends of expression are fitted by Gaussian function above the columns of expression levels at different concentrations of JdB. (C) Red production of different adpA-overexpression strains. A concentration of 4 mM theophylline (Theo) was used to induce M145::RadpA. The values represent the average of at least three independent cultures plus SDs. (Inset) The Red production phenotypes of the adpA-overexpression strains on SMM plate: a, M145; b, M145::EadpA; c, M145::RadpA. (D) The signal transduction circuit controlling survival responses to JdB in S. coelicolor M145.

