Fig. 5.
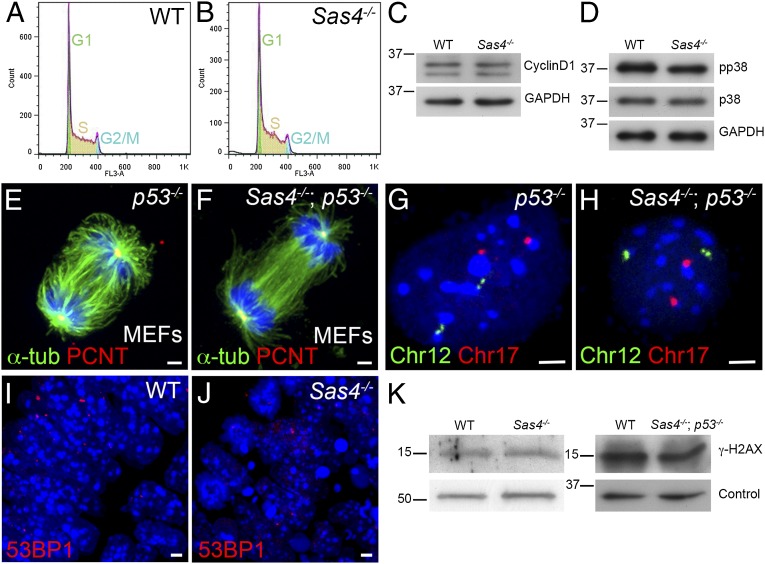
Cell-cycle profile, chromosome segregation, and the DNA damage response are normal in Sas4−/− mutants. (A and B) Cell-cycle profiles of cells isolated from E8.5 wild-type (A) and Sas4−/− (B) embryos. (C) Western blots show similar levels of cyclin D1 in wild-type and mutant E8.5 embryo extracts. (D) Phospho-p38 (pp38, T180/Y182) is not elevated in E8.5 Sas4−/− embryo extracts. (E and F) Mitotic spindles from p53−/− (control) and Sas4−/− p53−/− MEFs stained with α-tubulin (green) and PCNT (red). (G and H) Sample FISH signals from dissociated cells of p53−/− control and Sas4−/− p53−/− embryos at E8.5 with two copies of chromosome 12 (green) and two copies of chromosome 17 (red). (I and J) Wild-type (I) and Sas4−/− (J) embryo sections at E8.5 (neural plate) stained with the DNA damage marker 53BP1. (K) Western blots of embryo extracts show that γ-H2AX is not elevated in Sas4−/− or Sas4−/− p53−/− cells at E8.5 relative to the respective wild types. For loading controls, α-tubulin was used for Sas4−/− and GAPDH for Sas4−/− p53−/−. (Scale bars: 3 µm.)

