Fig. 6.
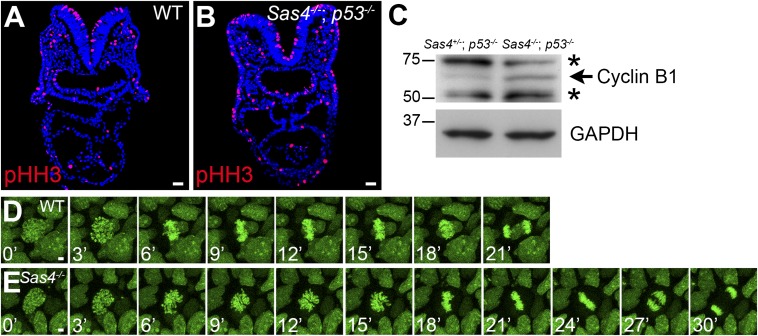
Prolonged mitosis in Sas4−/− embryos. (A and B) Cross-sections of E8.5 embryos show an increase in the number of mitotic cells (pHH3+; red) in Sas4−/− p53−/− embryos. (C) Western blots show an increase in cyclin B1 (arrow) in E8.5 Sas4−/− p53−/− embryos. Asterisks mark nonspecific bands. (D and E) Snapshots from time-lapse imaging of dividing cells in cultured E7.5 wild-type (D) and Sas4−/− (E) H2B-GFP+ embryos. (Scale bars: 30 µm in A and B, 3 µm in D and E.)

