Fig. 1.
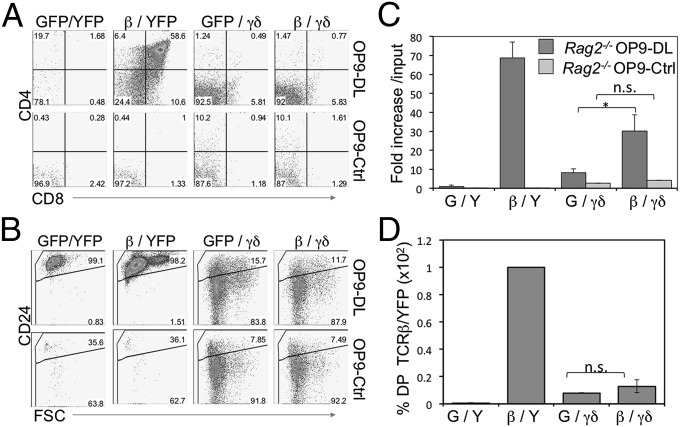
γδ-TCR–expressing DN3 cells predominantly differentiate along the γδ-lineage, irrespective of TCR-β coexpression and the availability of Notch signals. (A and B) Developmental progression of in vitro-derived Rag2−/− DN3 cells retrovirally transduced to express TCR-β, γδ-TCR, neither, or both, and cultured for 6 d with OP9-DL or OP9-Ctrl cells. Flow cytometric analysis of cell surface expression for CD4 and CD8 (A), and CD24 along with forward size scatter (FSC) (B) are shown for GFP+ YFP+-gated cells; C shows the corresponding fold-expansion in cellularity. Fold-expansion was obtained from the total cellularity divided by the number of cells used at the start of the culture (input). (D) Bar graph showing percentage of DP from the indicated cocultures in relation to TCR-β/YFP–transduced cells set at 100. Data are derived from at least three independent experiments. GFP(G), MigR1-transduced; YFP(Y), MIY-transduced.

