Fig. 2.
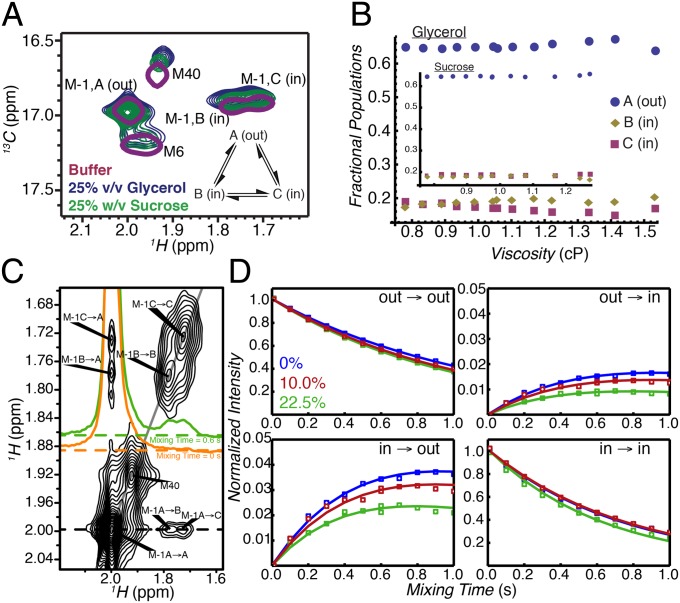
Probing the kinetics of in/out α7 gate interconversion by magnetization exchange NMR spectroscopy. (A) Selected regions of 13C,1H HSQC spectra of 2H, 13CH3-M, M1I α7, 14.0 T, 45 °C dissolved in buffer (single magenta contour), in buffer + 25% (vol/vol) glycerol (blue contours), and in buffer + 25% (wt/vol) sucrose (green contours). (B) Fractional populations of the M-1A (out), M-1B (in), and M-1C (in) α7 gate conformations as a function of viscosity during the course of glycerol (sucrose, Inset) titrations. (C) Two-dimensional 1H,1H plane from a 13C-edited magnetization exchange experiment (17) recorded in 22.5% (vol/vol) glycerol with a mixing time of 0.6 s. Cross-peaks arise because of slow conformational exchange between out (M-1A) and in (M-1B and M-1C) states. Correlations connecting states B and C are not resolved because of the significant line broadening due to the high viscosity of the sample. The orange and green 1D traces through the M-1A resonance highlight the absence of exchange cross-peaks when the mixing time is zero (orange) and their presence (green) for nonzero mixing times. (D) Normalized auto- and cross-peak intensities vs. mixing time at 0% (blue), 10.0% (red), and 22.5% (vol/vol) (green) glycerol concentrations. The  auto- and
  cross-peaks were normalized by the intensity at time 0 of the
  auto-peak, whereas the
  auto- and
  cross-peaks were normalized by the intensity at time 0 of the
  auto-peak. Solid curves are from fits to a two-site exchange model, described in Supporting Information. Error bars denoting uncertainties in peak intensities were calculated from duplicate measurements at two mixing times and are smaller than the symbols used to denote the intensity values.

