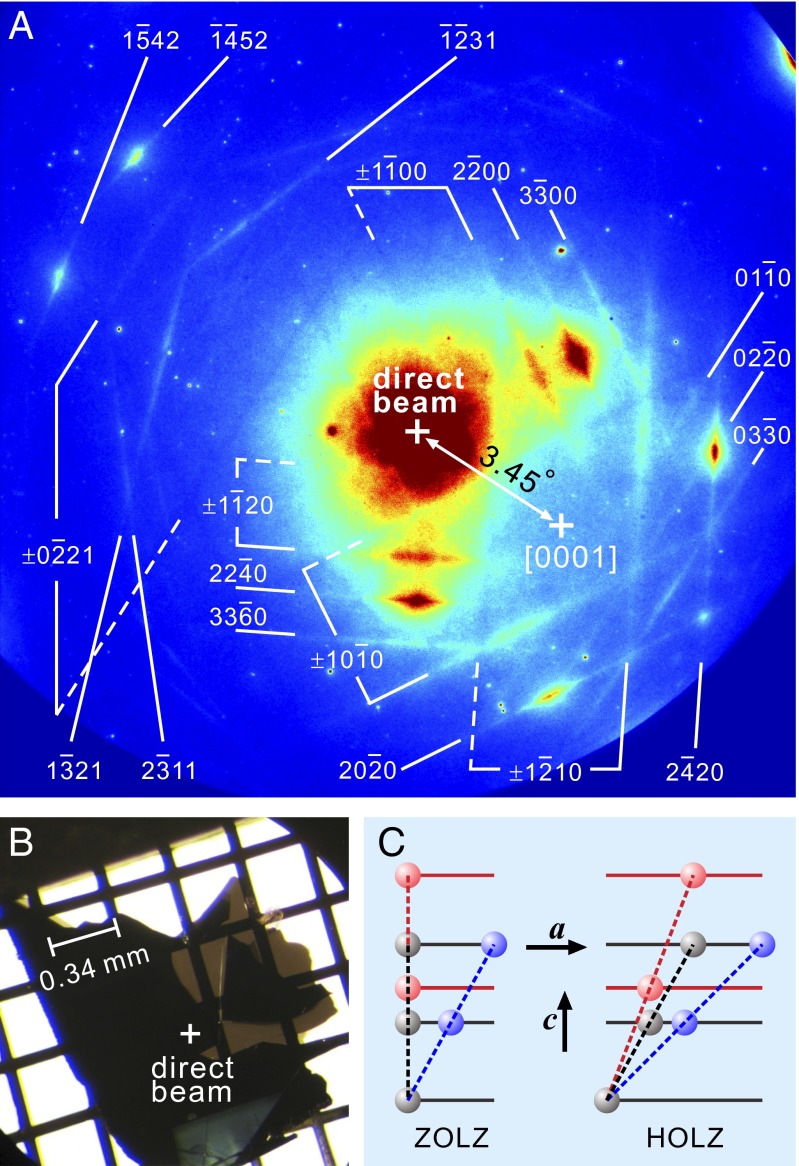
Fig. 1.
Kikuchi diffraction of graphite. (A) A representative pattern together with the indexed Kikuchi lines. Dashed and solid lines represent “deficiency” and “excess” lines (12), respectively. (B) Free-standing single crystalline graphite sample on a TEM grid. The white + marks the probed position. (C) Gray and colored dashed lines denote, respectively, lattice planes at equilibrium and when lattice deformation occurs. The blue lines represent the tilting of a ZOLZ plane (Left) and of a HOLZ plane (Right) as induced by an in-plane shear motion along the a-axis. The red lines represent the effect of a longitudinal motion along the c-axis; only for the HOLZ plane (Right) is there an effective tilting.

