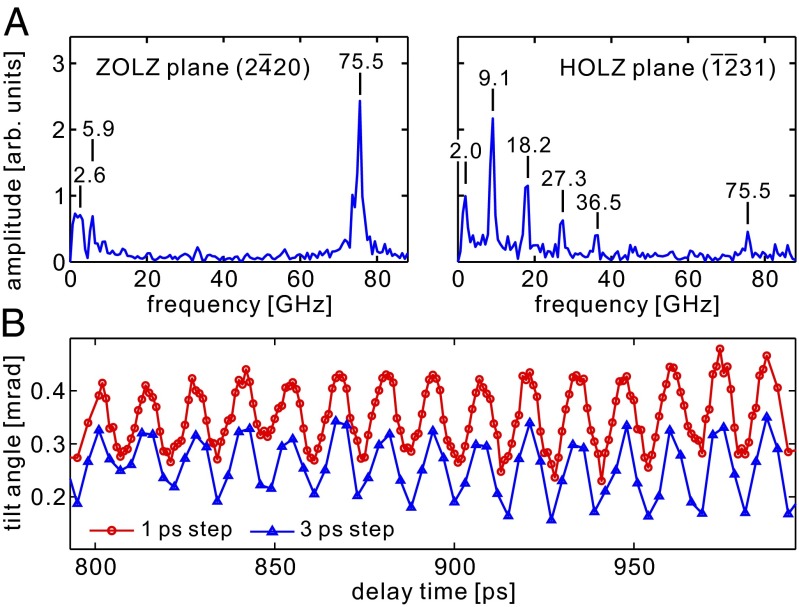
Fig. 3.
FFT spectra and oscillation period. (A) FFT spectra of the dynamics after time zero for the ZOLZ plane (2 20) (Left) and for the HOLZ plane (
 31) (Right). The spectral resolution of the FFT is 0.65 GHz. (B) Close view of the oscillations at 75.5 GHz from the ZOLZ plane (2
 20), measured with time steps of 1 ps (red) and 3 ps (blue). Both profiles exhibit the same sinusoidal behavior with identical periods and matching phase (see text).

