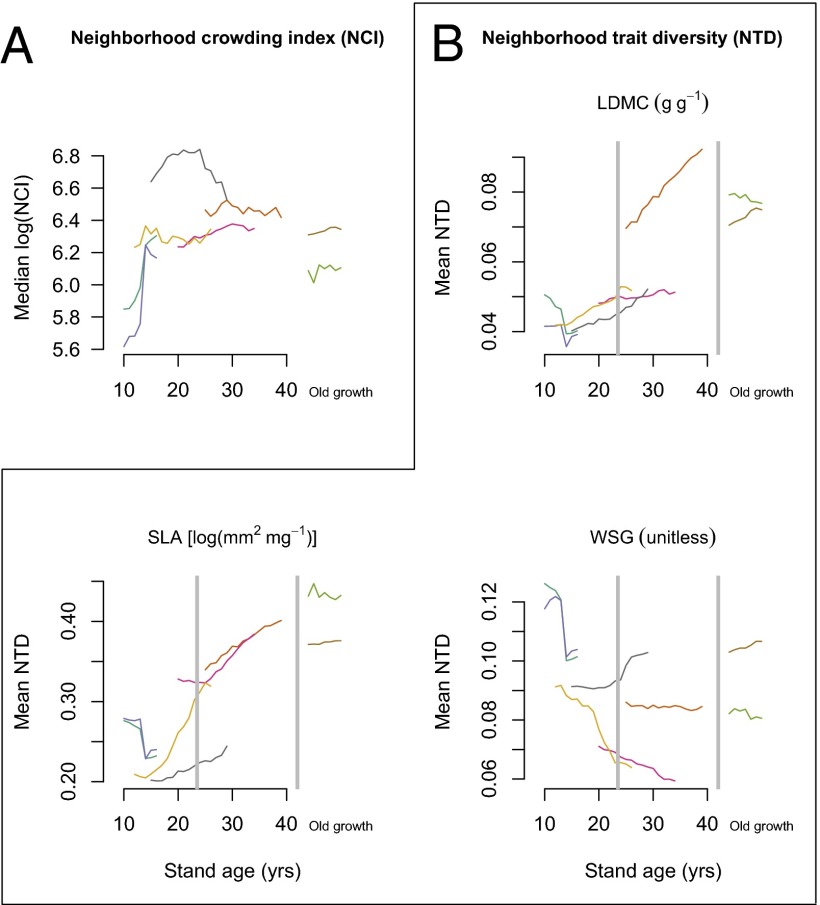
Fig. 3.
Change in stem neighborhoods with increasing stand age. (A) Change in median NCI [log(NCI)] (Methods). (B) Change in NTD, which is weighted by neighbor proximity and size. Gray lines indicate divisions between stand age categories used to test the effect of stand age on NTD. NTD represents the average trait difference between focal trees and their neighbors weighted by neighbor size and proximity calculated for each trait (Methods). Each of the eight 1-ha forest plots is represented by a differently colored line.

